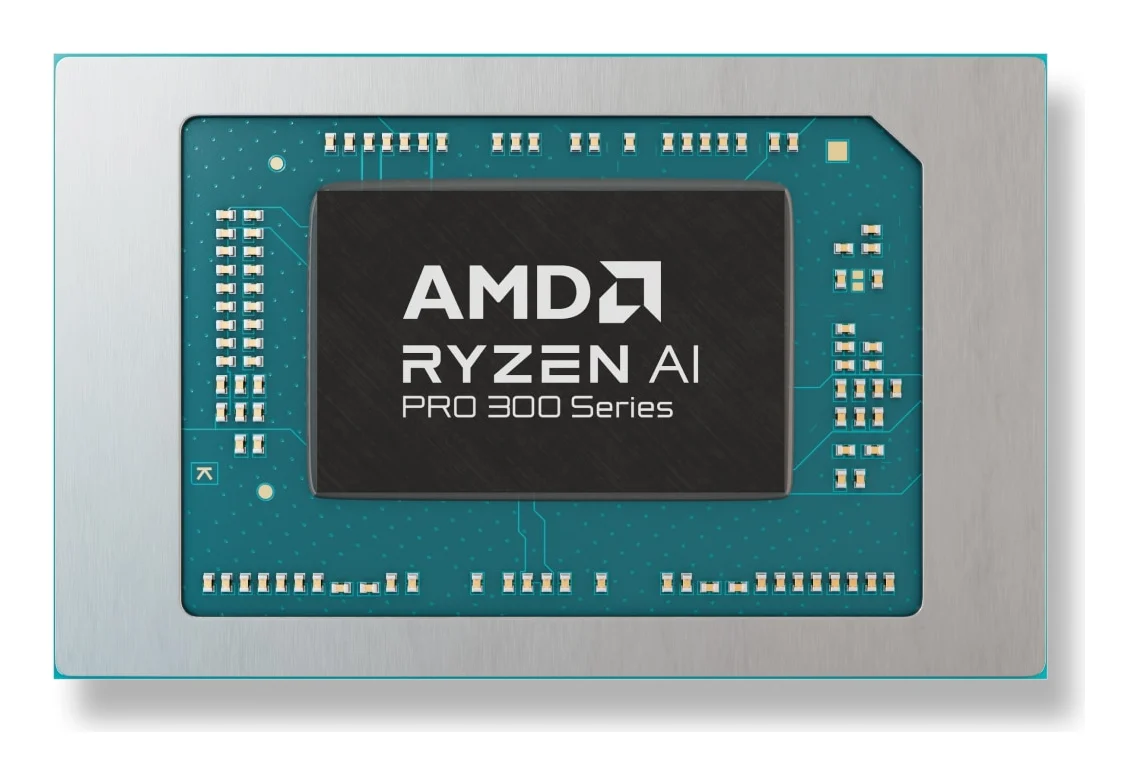
AMD Ryzen AI 7 PRO 350 vs Intel Core Ultra X7 368H
68.4Single-core72.9
49.2Multi-core56.8
73.5Efficiencyspec-based54.8
67.5iGPU—
61.8Platformspec-based56.4
2 spec wins — AMD Ryzen AI 7 PRO 35012 spec wins — Intel Core Ultra X7 368H
InnoReviews verdict
This one is close to a dead heat: AMD Ryzen AI 7 PRO 350 scores 61.4 against 60.9 for Intel Core Ultra X7 368H. Pick by the categories that matter to you, or by price.
Which would you pick?
Key differences
Reasons to pick the AMD Ryzen AI 7 PRO 350
- 167% higher Max memory: 256 GB vs 96 GB
- 78% lower process: 4 nm vs 18 nm
Reasons to pick the Intel Core Ultra X7 368H
- Stronger single-core score: 73 vs 68
- Stronger multi-core score: 57 vs 49
- 200% higher Efficiency cores: 12 vs 4
- 100% higher cores: 16 vs 8
- 48% higher Max TDP: 80 W vs 54 W
General
| Spec | AMD Ryzen AI 7 PRO 350 | Intel Core Ultra X7 368H |
|---|---|---|
| Announced | 2025 | 2026 |
| Process | 4 nm+78% | 18 nm |
| Base TDP | 28 W | 25 W+11% |
| Max TDP | 54 W | 80 W+48% |
Cores & Clocks
| Spec | AMD Ryzen AI 7 PRO 350 | Intel Core Ultra X7 368H |
|---|---|---|
| Cores | 8 | 16+100% |
| Performance cores | 4 | 4 |
| Efficiency cores | 4 | 12+200% |
| Threads | 16 | 16 |
| Base clock | 2 GHz | 2 GHz |
| Boost clock | 5 GHz | 5 GHz |
| L3 cache | 16 MB | 18 MB+13% |
Integrated GPU
| Spec | AMD Ryzen AI 7 PRO 350 | Intel Core Ultra X7 368H |
|---|---|---|
| iGPU | AMD Radeon 860M (8 CU) | Intel Arc B390 |
| iGPU clock | 3,000 MHz | 2,500 MHz |
Memory
| Spec | AMD Ryzen AI 7 PRO 350 | Intel Core Ultra X7 368H |
|---|---|---|
| Memory support | DDR5-5600 / LPDDR5X-8000 | LPDDR5X-9600 |
| Max memory | 256 GB+167% | 96 GB |
Benchmarks
| Spec | AMD Ryzen AI 7 PRO 350 | Intel Core Ultra X7 368H |
|---|---|---|
| Geekbench 6 (single) | 2,881Top 21% | 2,962+3%Top 16% |
| Geekbench 6 (multi) | 13,181Top 37% | 15,438+17%Top 19% |
| Cinebench R23 (single) | 1,959Top 23% | 2,155+10%Top 8% |
| Cinebench R23 (multi) | 14,308Top 44% | 17,201+20%Top 31% |
| PassMark | 24,015Top 41% | 33,544+40%Top 20% |
| PassMark (single thread) | 3,874Top 37% | 4,017+4%Top 26% |
| 3DMark Time Spy Graphics (iGPU) | 2,552Top 38% | — |
Related comparisons
AMD Ryzen AI 7 PRO 350vs NVIDIA RTX Spark N1XVSAMD Ryzen AI 7 PRO 350vs Qualcomm Snapdragon X2 Elite X2E-78-100VSAMD Ryzen AI 7 PRO 350vs Qualcomm Snapdragon X2 Plus X2P-64-100VSAMD Ryzen AI 7 PRO 350vs Intel Core i9-13980HXVSIntel Core Ultra X7 368Hvs AMD Ryzen AI 7 350VSIntel Core Ultra X7 368Hvs AMD Ryzen AI 7 PRO 360VSIntel Core Ultra X7 368Hvs Qualcomm Snapdragon X2 Plus X2P-64-100VSIntel Core Ultra X7 368Hvs Qualcomm Snapdragon X2 Elite X2E-78-100VS