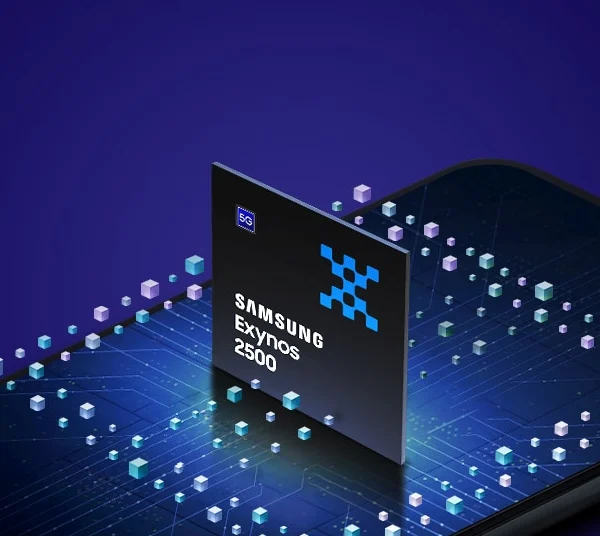
Samsung Exynos 2500 vs Unisoc T616
57.2CPU20.1
54.3GPU23.6
74.2Benchmarks—
85.9AIspec-based—
79.6Efficiencyspec-based20
7 spec wins — Samsung Exynos 25000 spec wins — Unisoc T616
InnoReviews verdict
Samsung Exynos 2500 wins this mobile chipset face-off, 66.1 to 21.3, pulling ahead mainly in CPU (+37) and GPU (+31). Unisoc T616 still makes sense if its price or standout specs fit your needs better.
Which would you pick?
Key differences
Reasons to pick the Samsung Exynos 2500
- Stronger CPU score: 57 vs 20
- Stronger GPU score: 54 vs 24
- 3285% higher 3DMark Wild Life Extreme: 4,400 vs 130
- 429% higher Geekbench 6 (single): 2,300 vs 435
- 428% higher Geekbench 6 (multi): 8,200 vs 1,553
Reasons to pick the Unisoc T616
No decisive spec advantages — this side competes on price and preference.
General
| Spec | Samsung Exynos 2500 | Unisoc T616 |
|---|---|---|
| Announced | 2025 | 2022 |
| Process | 3 nm+75% | 12 nm |
| TDP (typical) | 8 W | — |
| Architecture | Armv9.2 | Armv8.2 |
CPU
| Spec | Samsung Exynos 2500 | Unisoc T616 |
|---|---|---|
| Cores | 10+25% | 8 |
| Core configuration | 1x3.3 GHz Cortex-X925 + 2x2.75 GHz Cortex-A725 + 5x2.36 GHz Cortex-A725 + 2x1.8 GHz Cortex-A520 | 2x2.0 GHz Cortex-A75 + 6x1.8 GHz Cortex-A55 |
| Max clock | 3.3 GHz+65% | 2 GHz |
GPU
| Spec | Samsung Exynos 2500 | Unisoc T616 |
|---|---|---|
| GPU | Samsung Xclipse 950 | Arm Mali-G57 MP1 |
| GPU clock | — | 750 MHz |
AI
| Spec | Samsung Exynos 2500 | Unisoc T616 |
|---|---|---|
| NPU | Samsung NPU | — |
| AI performance | 59 TOPS | — |
Memory
| Spec | Samsung Exynos 2500 | Unisoc T616 |
|---|---|---|
| Memory type | LPDDR5X | LPDDR4X-1866 |
Connectivity
| Spec | Samsung Exynos 2500 | Unisoc T616 |
|---|---|---|
| Modem | Integrated Exynos 5G modem | Integrated LTE Cat-7 |
| Wi-Fi | — | Wi-Fi 5 |
| Bluetooth | — | 5.0 |
Media
| Spec | Samsung Exynos 2500 | Unisoc T616 |
|---|---|---|
| Max display | — | FHD+ @ 60Hz / HD+ @ 90Hz |
| Video capture | 8K@30fps | 1080p@60fps |
Benchmarks
| Spec | Samsung Exynos 2500 | Unisoc T616 |
|---|---|---|
| AnTuTu | 2,150,000 | — |
| Geekbench 6 (single) | 2,300+429%Top 13% | 435Bottom 16% |
| Geekbench 6 (multi) | 8,200+428%Top 10% | 1,553Bottom 17% |
| 3DMark Wild Life Extreme | 4,400+3285%Top 18% | 130Bottom 2% |