AMD Ryzen 7 8845HS vs Apple M2 Max (12-core)
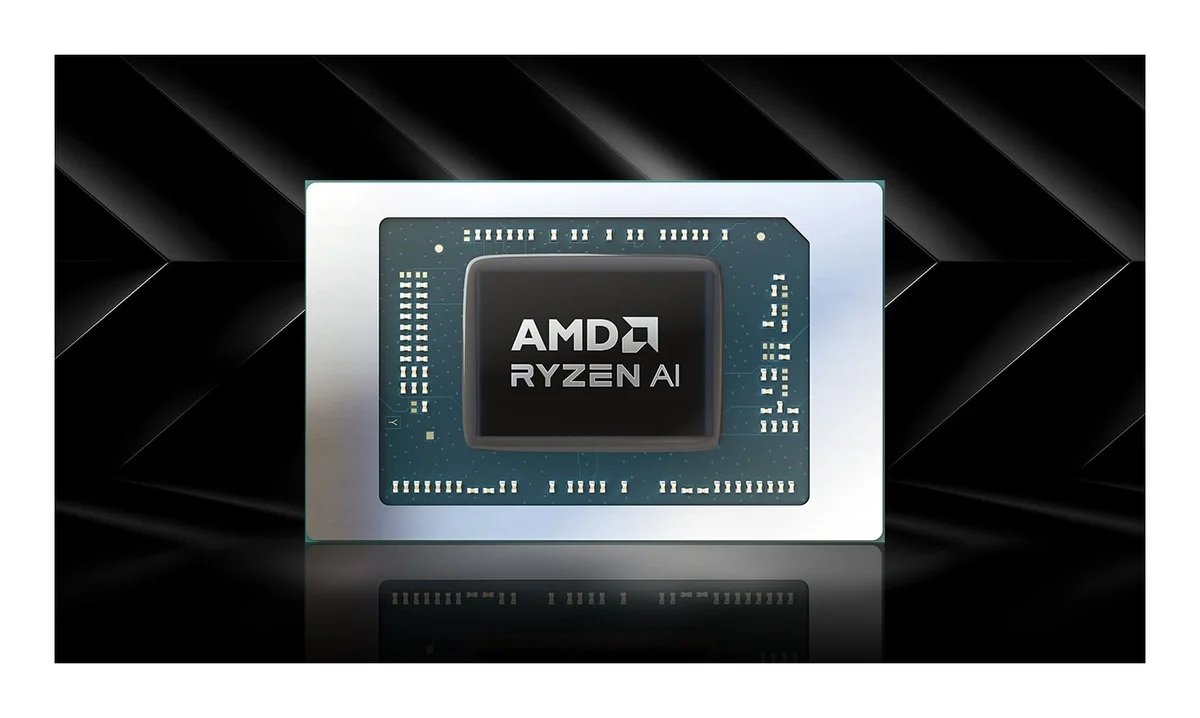
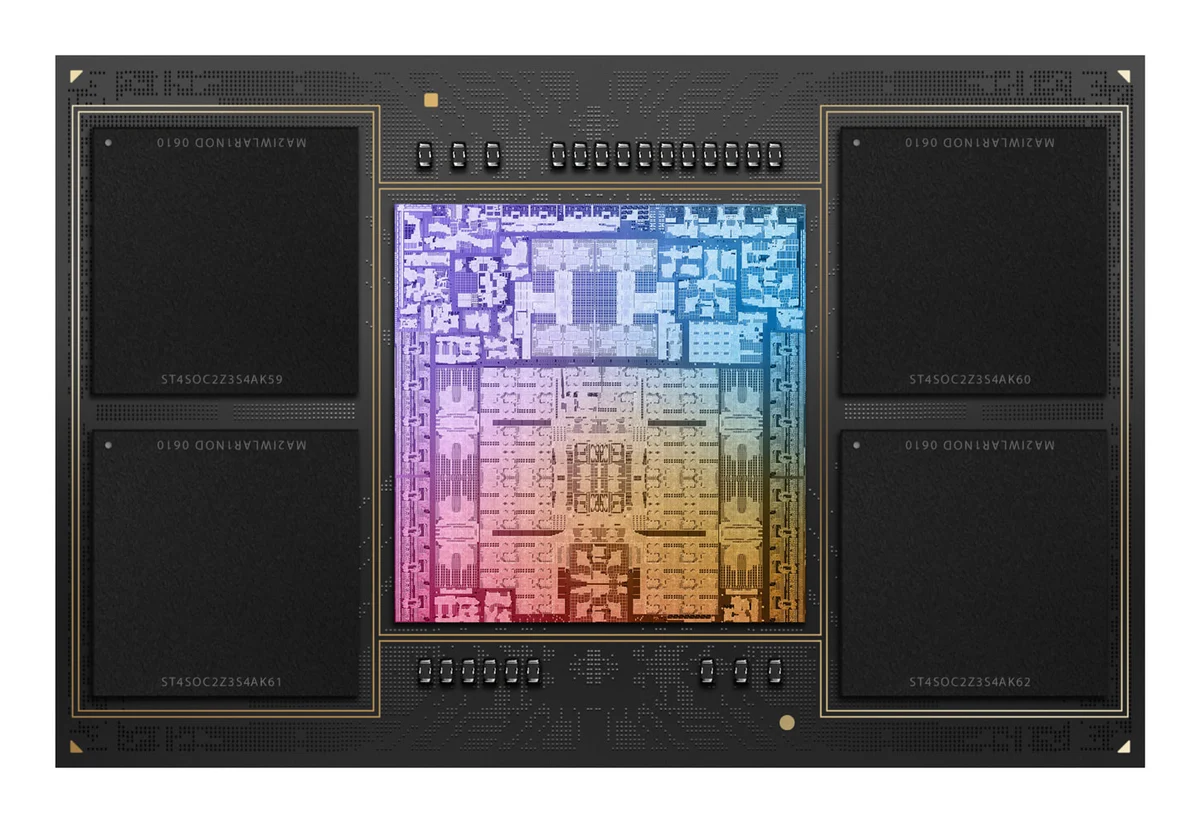
61.8Single-core61.2
51.3Multi-core52.3
65.4Efficiencyspec-based80
69.7iGPU—
61.8Platformspec-based52.8
7 spec wins — AMD Ryzen 7 8845HS4 spec wins — Apple M2 Max (12-core)
InnoReviews verdict
This one is close to a dead heat: AMD Ryzen 7 8845HS scores 59.5 against 59.5 for Apple M2 Max (12-core). Pick by the categories that matter to you — AMD Ryzen 7 8845HS edges ahead in single-core, or by price.
Which would you pick?
Key differences
Reasons to pick the AMD Ryzen 7 8845HS
- 167% higher Max memory: 256 GB vs 96 GB
- 39% higher Boost clock: 5.1 GHz vs 3.7 GHz
- 33% higher threads: 16 vs 12
- 20% lower process: 4 nm vs 5 nm
- 10% higher Cinebench R23 (multi): 16,192 vs 14,753
Reasons to pick the Apple M2 Max (12-core)
- 50% higher cores: 12 vs 8
- 15% higher Geekbench 6 (multi): 14,770 vs 12,889
- 11% higher PassMark (single thread): 4,134 vs 3,718
General
| Spec | AMD Ryzen 7 8845HS | Apple M2 Max (12-core) |
|---|---|---|
| Announced | 2023 | 2023 |
| Process | 4 nm+20% | 5 nm |
| Base TDP | 35 W | — |
| Max TDP | 54 W | — |
Cores & Clocks
| Spec | AMD Ryzen 7 8845HS | Apple M2 Max (12-core) |
|---|---|---|
| Cores | 8 | 12+50% |
| Performance cores | 8 | 8 |
| Efficiency cores | — | 4 |
| Threads | 16+33% | 12 |
| Base clock | 3.8 GHz | — |
| Boost clock | 5.1 GHz+39% | 3.7 GHz |
| L3 cache | 16 MB | — |
Integrated GPU
| Spec | AMD Ryzen 7 8845HS | Apple M2 Max (12-core) |
|---|---|---|
| iGPU | AMD Radeon 780M | Apple 38-core GPU |
| iGPU clock | 2,700 MHz | — |
Memory
| Spec | AMD Ryzen 7 8845HS | Apple M2 Max (12-core) |
|---|---|---|
| Memory support | LPDDR5X-7500 / DDR5-5600 | LPDDR5-6400 |
| Max memory | 256 GB+167% | 96 GB |
Benchmarks
| Spec | AMD Ryzen 7 8845HS | Apple M2 Max (12-core) |
|---|---|---|
| Geekbench 6 (single) | 2,618Top 47% | 2,757+5%Top 33% |
| Geekbench 6 (multi) | 12,889Top 38% | 14,770+15%Top 24% |
| Cinebench R23 (single) | 1,769+8%Bottom 48% | 1,644Bottom 31% |
| Cinebench R23 (multi) | 16,192+10%Top 36% | 14,753Top 43% |
| PassMark | 28,280+5%Top 30% | 26,834Top 34% |
| PassMark (single thread) | 3,718Top 47% | 4,134+11%Top 15% |
| 3DMark Time Spy Graphics (iGPU) | 2,808Top 24% | — |
Related comparisons
AMD Ryzen 7 8845HSvs AMD Ryzen 7 7840HSVSAMD Ryzen 7 8845HSvs Qualcomm Snapdragon X2 Plus X2P-42-100VSAMD Ryzen 7 8845HSvs AMD Ryzen 9 7940HSVSAMD Ryzen 7 8845HSvs Intel Core i7-12800HXVSApple M2 Max (12-core)vs AMD Ryzen 7 7840HSVSApple M2 Max (12-core)vs Qualcomm Snapdragon X2 Plus X2P-42-100VSApple M2 Max (12-core)vs AMD Ryzen 9 7940HSVSApple M2 Max (12-core)vs Intel Core i7-12800HXVS