AMD Ryzen 5 7600X3D vs AMD Ryzen 9 3950X
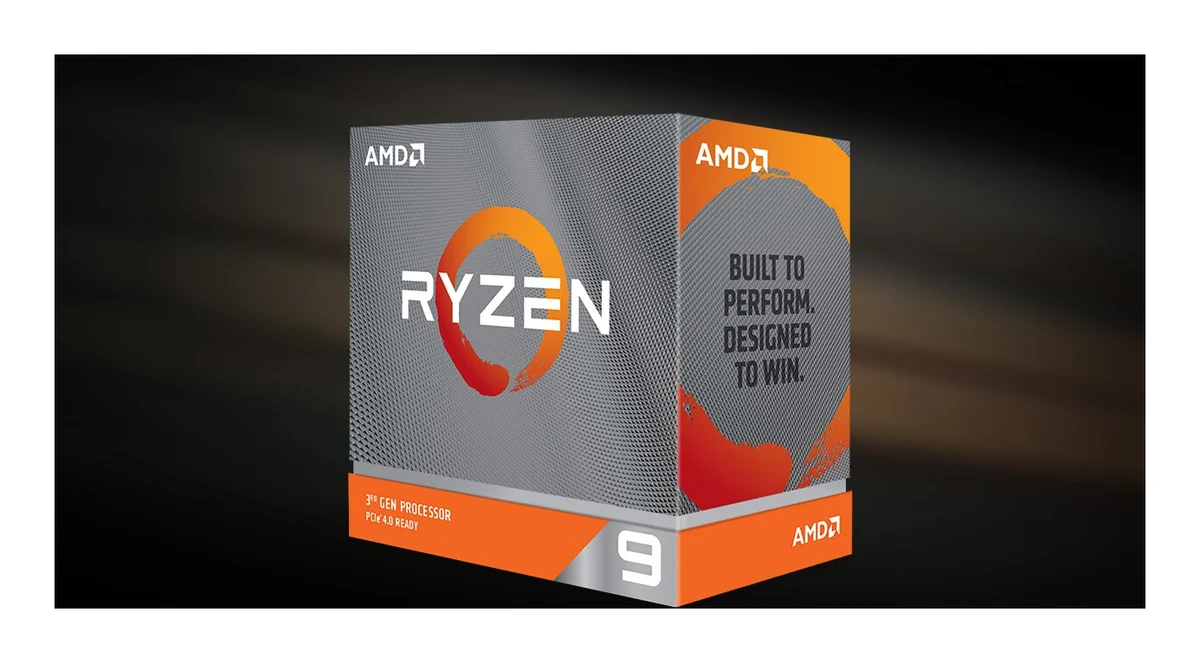
60.7Single-core39.5
48.3Multi-core65.7
88.8Gamingspec-based79
7 spec wins — AMD Ryzen 5 7600X3D4 spec wins — AMD Ryzen 9 3950X
InnoReviews verdict
This one is close to a dead heat: AMD Ryzen 5 7600X3D scores 62.1 against 61.2 for AMD Ryzen 9 3950X. Pick by the categories that matter to you — AMD Ryzen 5 7600X3D edges ahead in single-core, or by price.
Which would you pick?
Key differences
Reasons to pick the AMD Ryzen 5 7600X3D
- Stronger single-core score: 61 vs 40
- 50% higher L3 cache: 96 MB vs 64 MB
- 38% lower Base TDP: 65 W vs 105 W
- 34% higher PassMark (single thread): 3,608 vs 2,701
- 29% lower process: 5 nm vs 7 nm
- Lower launch price: $299 vs $749
Reasons to pick the AMD Ryzen 9 3950X
- Stronger multi-core score: 66 vs 48
- 167% higher cores: 16 vs 6
- 167% higher threads: 32 vs 12
- 48% higher PassMark: 38,396 vs 25,868
- 33% higher L2 cache: 8 MB vs 6 MB
General
| Spec | AMD Ryzen 5 7600X3D | AMD Ryzen 9 3950X |
|---|---|---|
| Announced | 2024 | 2019 |
| Socket | AM5 | AM4 |
| Process | 5 nm+29% | 7 nm |
| Base TDP | 65 W+38% | 105 W |
| Max turbo power | — | 142 W |
| Unlocked multiplier | — | Yes |
| Cooler included | No | No |
Cores & Clocks
| Spec | AMD Ryzen 5 7600X3D | AMD Ryzen 9 3950X |
|---|---|---|
| Cores | 6 | 16+167% |
| Performance cores | — | 16 |
| Efficiency cores | — | 0 |
| Threads | 12 | 32+167% |
| Base clock | 4.1 GHz+17% | 3.5 GHz |
| Boost clock | 4.7 GHz | 4.7 GHz |
| L2 cache | 6 MB | 8 MB+33% |
| L3 cache | 96 MB+50% | 64 MB |
Integrated GPU
| Spec | AMD Ryzen 5 7600X3D | AMD Ryzen 9 3950X |
|---|---|---|
| iGPU | AMD Radeon Graphics | — |
| iGPU clock | 2,200 MHz | — |
Memory
| Spec | AMD Ryzen 5 7600X3D | AMD Ryzen 9 3950X |
|---|---|---|
| Memory support | DDR5-5200 | DDR4-3200 |
| Max memory | 128 GB | 128 GB |
| Memory channels | 2 | 2 |
Platform
| Spec | AMD Ryzen 5 7600X3D | AMD Ryzen 9 3950X |
|---|---|---|
| PCIe version | 5+25% | 4 |
| CPU PCIe lanes | 24 | 24 |
Benchmarks
| Spec | AMD Ryzen 5 7600X3D | AMD Ryzen 9 3950X |
|---|---|---|
| Cinebench R23 (single) | — | 1,320Bottom 31% |
| Cinebench R23 (multi) | — | 24,700Top 23% |
| PassMark | 25,868Top 42% | 38,396+48%Top 23% |
| PassMark (single thread) | 3,608+34%Top 40% | 2,701Bottom 29% |
Use this on your site or forum
Copy a ready-made link. Scores on this page update as new results are published, so the link always leads to the current figures.
HTML (for a website or blog)
Markdown (Reddit, GitHub, Discord)
BBCode (forums)
Related comparisons
AMD Ryzen 5 7600X3Dvs Intel Core i7-12700VSAMD Ryzen 5 7600X3Dvs Intel Core Ultra 5 225VSAMD Ryzen 5 7600X3Dvs AMD Ryzen 9 5900VSAMD Ryzen 5 7600X3Dvs AMD Ryzen 9 5900XVSAMD Ryzen 9 3950Xvs Intel Core i7-12700VSAMD Ryzen 9 3950Xvs Intel Core Ultra 5 225VSAMD Ryzen 9 3950Xvs AMD Ryzen 5 7600XVSAMD Ryzen 9 3950Xvs Intel Core i5-13600VS