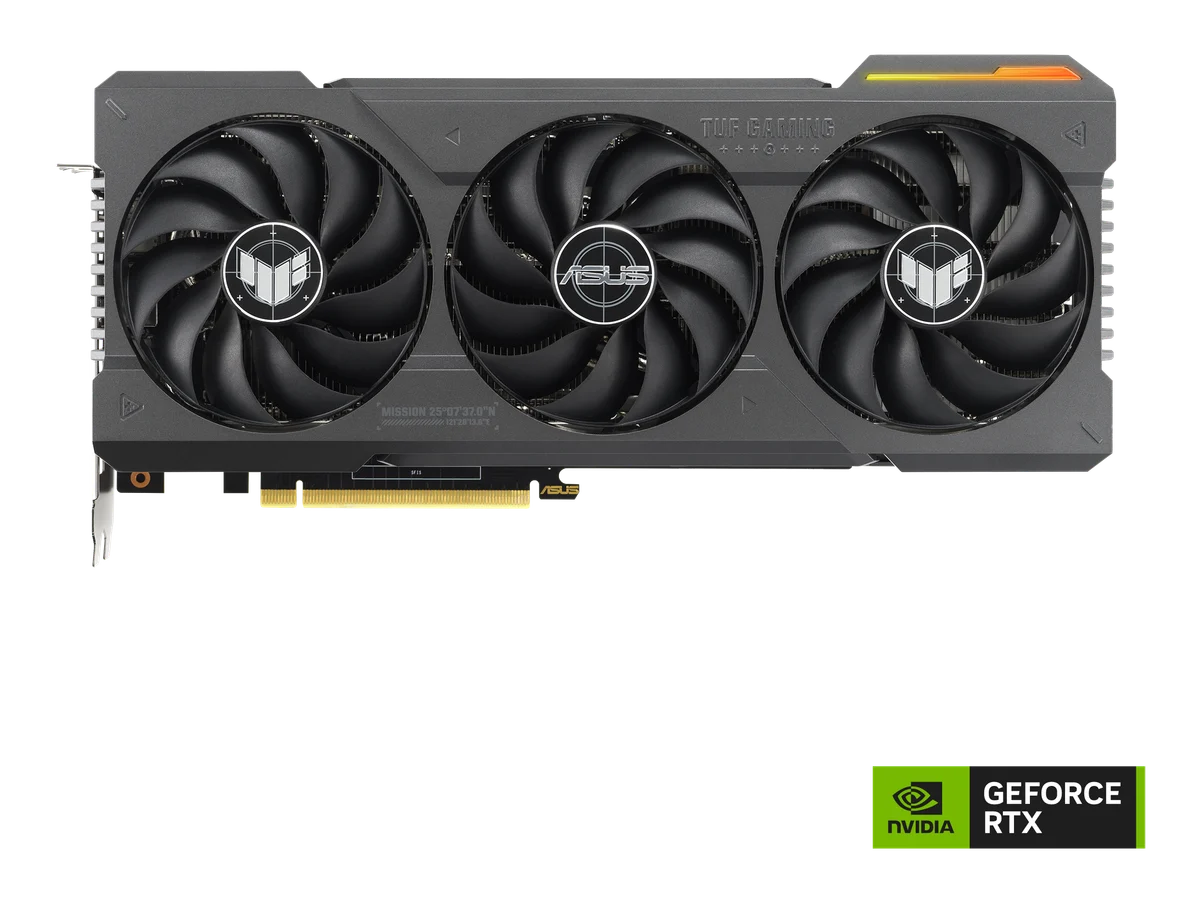
NVIDIA GeForce RTX 4070 Ti vs NVIDIA RTX A6000
50.3Rasterization43.9
44.2Ray Tracing41.8
51.9Memoryspec-based85.3
75.6Efficiencyspec-based69.5
71.4Compute60
6 spec wins — NVIDIA GeForce RTX 4070 Ti6 spec wins — NVIDIA RTX A6000
InnoReviews verdict
This one is close to a dead heat: NVIDIA GeForce RTX 4070 Ti scores 56.3 against 55.9 for NVIDIA RTX A6000. Pick by the categories that matter to you — NVIDIA GeForce RTX 4070 Ti edges ahead in compute and rasterization, or by price.
Which would you pick?
Key differences
Reasons to pick the NVIDIA GeForce RTX 4070 Ti
- Stronger rasterization score: 50 vs 44
- Stronger compute score: 71 vs 60
- 45% higher Boost clock: 2,610 MHz vs 1,800 MHz
- 39% higher PassMark G3D: 31,507 vs 22,606
- 28% higher 3DMark Time Spy: 22,743 vs 17,801
Reasons to pick the NVIDIA RTX A6000
- 300% higher VRAM: 48 GB vs 12 GB
- 100% higher Bus width: 384 bit vs 192 bit
- 52% higher bandwidth: 768 GB/s vs 504 GB/s
- 40% higher Shading units: 10,752 vs 7,680
- 40% higher RT cores: 84 vs 60
General
| Spec | NVIDIA GeForce RTX 4070 Ti | NVIDIA RTX A6000 |
|---|---|---|
| Announced | 2023 | 2020 |
| Architecture | Ada Lovelace | Ampere |
| Process | 5 nm | — |
| TDP | 285 W+5% | 300 W |
| Power connector | 1x 16-pin | 1x 8-pin CPU |
Cores & Clocks
| Spec | NVIDIA GeForce RTX 4070 Ti | NVIDIA RTX A6000 |
|---|---|---|
| Shading units | 7,680 | 10,752+40% |
| RT cores | 60 | 84+40% |
| Tensor / AI cores | 240 | 336+40% |
| Base clock | 2,310 MHz | — |
| Boost clock | 2,610 MHz+45% | 1,800 MHz |
Memory
| Spec | NVIDIA GeForce RTX 4070 Ti | NVIDIA RTX A6000 |
|---|---|---|
| VRAM | 12 GB | 48 GB+300% |
| VRAM type | GDDR6X | GDDR6 |
| Bus width | 192 bit | 384 bit+100% |
| Bandwidth | 504 GB/s | 768 GB/s+52% |
Benchmarks
| Spec | NVIDIA GeForce RTX 4070 Ti | NVIDIA RTX A6000 |
|---|---|---|
| 3DMark Time Spy | 22,743+28%Top 15% | 17,801Top 25% |
| 3DMark Speed Way | 5,532+9%Top 22% | 5,081Top 29% |
| PassMark G3D | 31,507+39%Top 8% | 22,606Top 33% |
| 1080p Ultra | 148 fpsTop 30% | — |
| 1440p Ultra | 110 fpsTop 33% | — |
| 4K Ultra | 63 fpsTop 35% | — |
Features
| Spec | NVIDIA GeForce RTX 4070 Ti | NVIDIA RTX A6000 |
|---|---|---|
| Upscaling | DLSS 4 (no MFG) | — |
Related comparisons
NVIDIA GeForce RTX 4070 Tivs NVIDIA GeForce RTX 4070 SuperVSNVIDIA GeForce RTX 4070 Tivs NVIDIA GeForce RTX 3090 TiVSNVIDIA GeForce RTX 4070 Tivs NVIDIA GeForce RTX 3090VSNVIDIA GeForce RTX 4070 Tivs NVIDIA GeForce RTX 5070VSNVIDIA RTX A6000vs NVIDIA GeForce RTX 4070 SuperVSNVIDIA RTX A6000vs NVIDIA GeForce RTX 3090VSNVIDIA RTX A6000vs NVIDIA GeForce RTX 3090 TiVSNVIDIA RTX A6000vs NVIDIA GeForce RTX 5070VS