Lenovo ThinkPad P1 Gen 9 vs MSI Crosshair 16 Max HX E2W
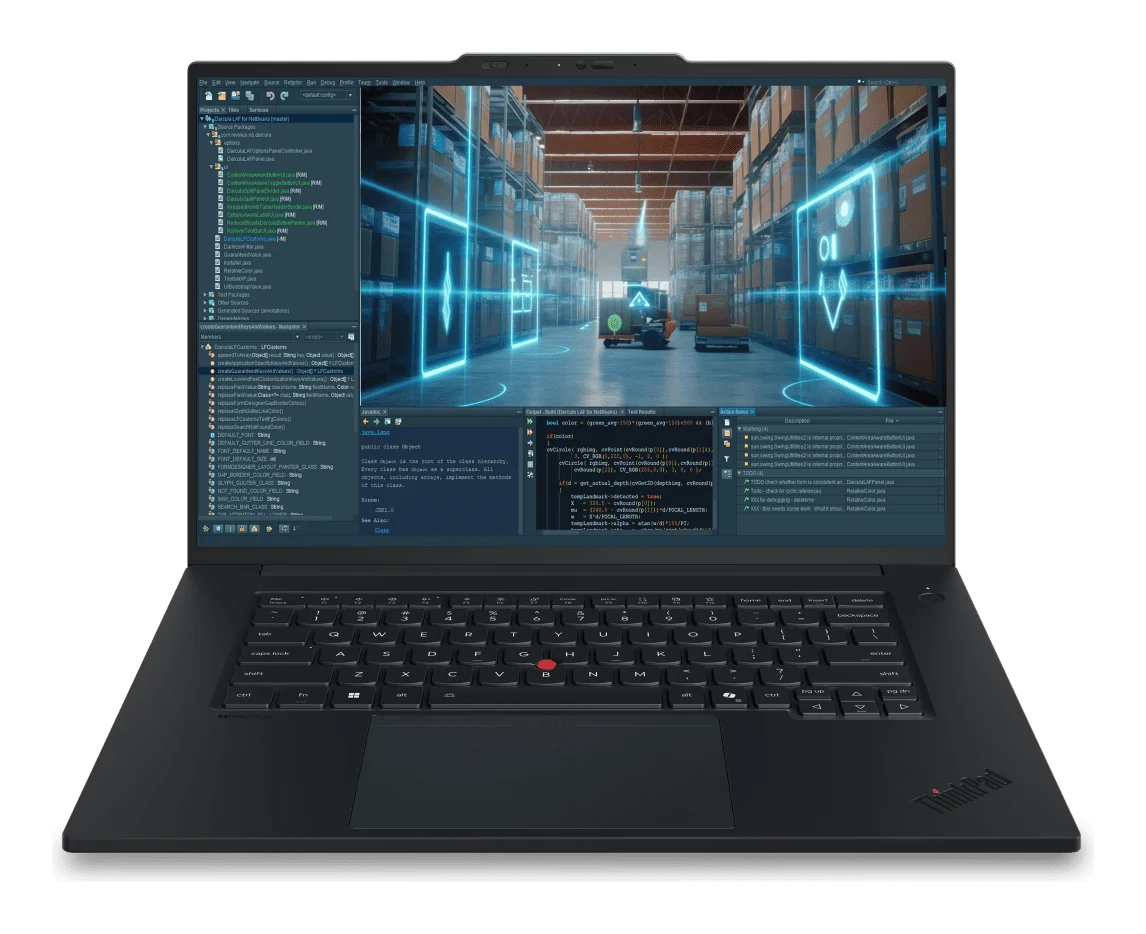
Lenovo ThinkPad P1 Gen 9: Intel Core Ultra 7 366H, released Jun 21, 2026
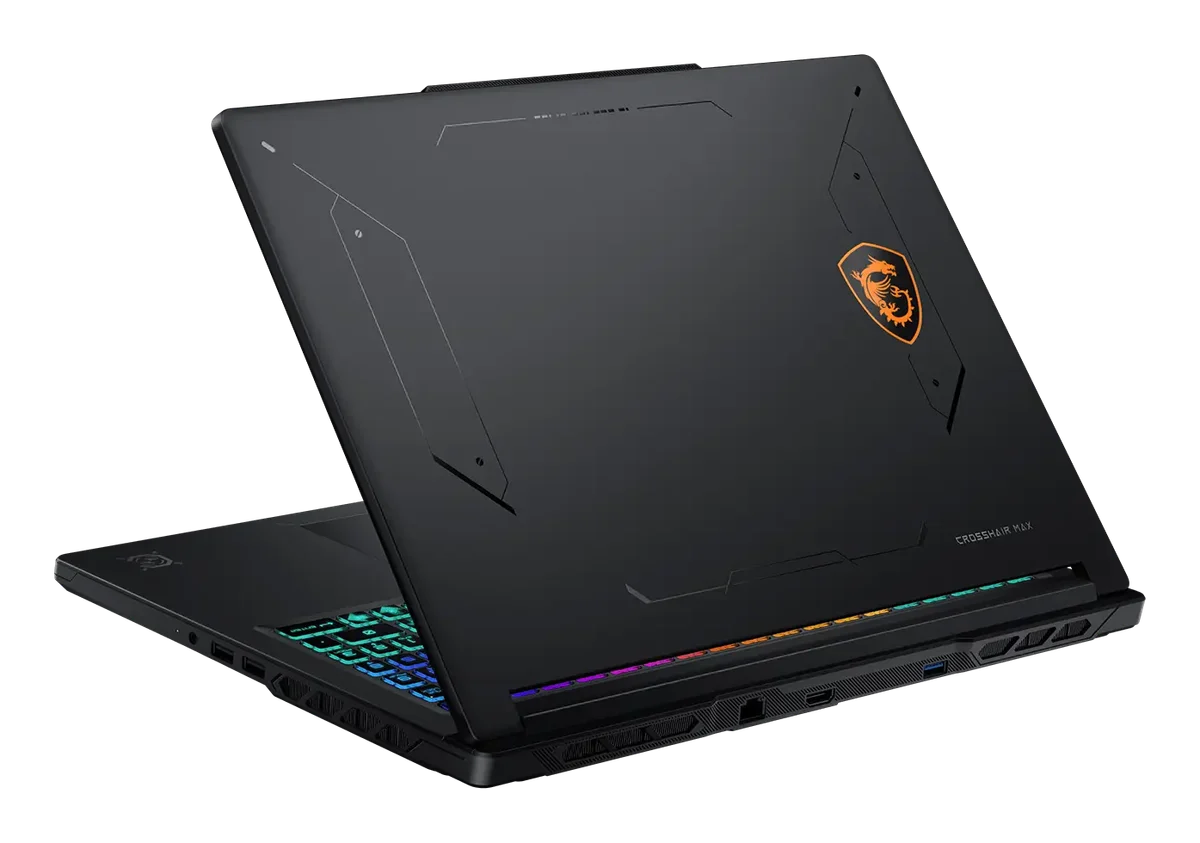
MSI Crosshair 16 Max HX E2W: Intel Core Ultra 9 290HX Plus, released May 31, 2026, $2,599
Chip vs chip: Intel Core Ultra 7 366H vs Intel Core Ultra 9 290HX Plus →
InnoReviews verdict
This one is close to a dead heat: Lenovo ThinkPad P1 Gen 9 scores 63.8 against 64.9 for MSI Crosshair 16 Max HX E2W. Pick by the categories that matter to you — MSI Crosshair 16 Max HX E2W edges ahead in graphics and performance, or by price.
Key differences
Reasons to pick the Lenovo ThinkPad P1 Gen 9
- 100% higher RAM: 64 GB vs 32 GB
- 100% higher storage: 2,048 GB vs 1,024 GB
- 18% lower weight: 1.8 kg vs 2.2 kg
- 14% lower thickness: 20.6 mm vs 23.9 mm
- 13% higher capacity: 90 Wh vs 80 Wh
Reasons to pick the MSI Crosshair 16 Max HX E2W
- 48% higher 3DMark Time Spy Graphics (GPU): 13,644 vs 9,204
- Stronger performance score: 69 vs 63
- 175% higher refresh rate: 165 Hz vs 60 Hz
- 71% higher charging: 240 W vs 140 W
Which would you pick?
Lenovo ThinkPad P1 Gen 9 vs MSI Crosshair 16 Max HX E2W: full specs
Display
| Spec | Lenovo ThinkPad P1 Gen 9 | MSI Crosshair 16 Max HX E2W |
|---|---|---|
| Screen size | 16 ″ | 16 ″ |
| Panel type | IPS | OLED |
| Resolution | 3840x2400 | 2560x1600 |
| Refresh rate | 60 Hz | 165 Hz+175% |
| Peak brightness | 800 nits | — |
Performance
| Spec | Lenovo ThinkPad P1 Gen 9 | MSI Crosshair 16 Max HX E2W |
|---|---|---|
| Processor | Intel Core Ultra 7 366H | Intel Core Ultra 9 290HX Plus |
| Graphics | NVIDIA RTX PRO 2000 Blackwell (8GB GDDR7) | NVIDIA GeForce RTX 5070 Laptop GPU |
| RAM | 64 GB+100% | 32 GB |
| RAM type | LPDDR5X-8533 (LPCAMM2) | DDR5 |
| Storage | 2,048 GB+100% | 1,024 GB |
| Storage type | NVMe SSD (M.2 2280, PCIe Gen 5) | PCIe 4.0 NVMe SSD |
Benchmarks
| Spec | Lenovo ThinkPad P1 Gen 9 | MSI Crosshair 16 Max HX E2W |
|---|---|---|
| 3DMark Time Spy Graphics (GPU) | 9,204Bottom 14% | 13,644+48%Top 31% |
Battery
| Spec | Lenovo ThinkPad P1 Gen 9 | MSI Crosshair 16 Max HX E2W |
|---|---|---|
| Capacity | 90 Wh+13% | 80 Wh |
| Charging | 140 W | 240 W+71% |
Design
| Spec | Lenovo ThinkPad P1 Gen 9 | MSI Crosshair 16 Max HX E2W |
|---|---|---|
| Weight | 1.8 kg+18% | 2.2 kg |
| Thickness | 20.6 mm+14% | 23.9 mm |
| Material | Aluminum | — |
Connectivity
| Spec | Lenovo ThinkPad P1 Gen 9 | MSI Crosshair 16 Max HX E2W |
|---|---|---|
| Ports | 2x Thunderbolt 5 (USB PD 3.1, DisplayPort 2.1), 1x Thunderbolt 4, 1x USB-A (10Gbps, always on), HDMI 2.1 (up to 8K/60Hz), SD Express 7.0 card reader, 3.5mm combo audio jack | 3x USB-A 3.2 Gen2, 1x USB-C 3.2 Gen2 (DisplayPort, PD 3.0), 1x Thunderbolt 4 (DisplayPort, PD 3.1), HDMI 2.1, 2.5 Gigabit Ethernet, 3.5mm combo jack |
| Wi-Fi | Wi-Fi 7 | Wi-Fi 6E |
| Bluetooth | 5.4 | — |
| Webcam | 5.0MP + IR camera with privacy shutter | 720p HD |
| Biometrics | Fingerprint reader in power button; IR camera for Windows Hello face recognition | — |
Software
| Spec | Lenovo ThinkPad P1 Gen 9 | MSI Crosshair 16 Max HX E2W |
|---|---|---|
| Operating system | Windows 11 Pro | Windows 11 Home |
Quick answers
Which is better: Lenovo ThinkPad P1 Gen 9 or MSI Crosshair 16 Max HX E2W?
This one is close to a dead heat: Lenovo ThinkPad P1 Gen 9 scores 63.8 against 64.9 for MSI Crosshair 16 Max HX E2W. Pick by the categories that matter to you — MSI Crosshair 16 Max HX E2W edges ahead in graphics and performance, or by price.
How do the scores compare?
Lenovo ThinkPad P1 Gen 9 scores 63.8/100 overall; MSI Crosshair 16 Max HX E2W scores 64.9/100. Lenovo ThinkPad P1 Gen 9 wins 5 individual spec rows, MSI Crosshair 16 Max HX E2W wins 3.
What are the main differences between the Lenovo ThinkPad P1 Gen 9 and the MSI Crosshair 16 Max HX E2W?
Lenovo ThinkPad P1 Gen 9 advantages: 100% higher RAM: 64 GB vs 32 GB; 100% higher storage: 2,048 GB vs 1,024 GB; 18% lower weight: 1.8 kg vs 2.2 kg; 14% lower thickness: 20.6 mm vs 23.9 mm; 13% higher capacity: 90 Wh vs 80 Wh. MSI Crosshair 16 Max HX E2W advantages: 48% higher 3DMark Time Spy Graphics (GPU): 13,644 vs 9,204; Stronger performance score: 69 vs 63; 175% higher refresh rate: 165 Hz vs 60 Hz; 71% higher charging: 240 W vs 140 W.
Use this on your site or forum
Copy a ready-made link. Scores on this page update as new results are published, so the link always leads to the current figures.