MSI Crosshair 17 HX AI D2XW vs Razer Blade 18 (2025)
MSI Crosshair 17 HX AI D2XW: Intel Core Ultra 9 275HX, released Jul 18, 2025
Razer Blade 18 (2025): Intel Core Ultra 9 275HX, released May 27, 2025, $3,500
The MSI Crosshair 17 HX AI D2XW is 2 months newer.
Both use the Intel Core Ultra 9 275HX, so raw chip performance is the same; the differences come from cooling, memory and the rest of the hardware.
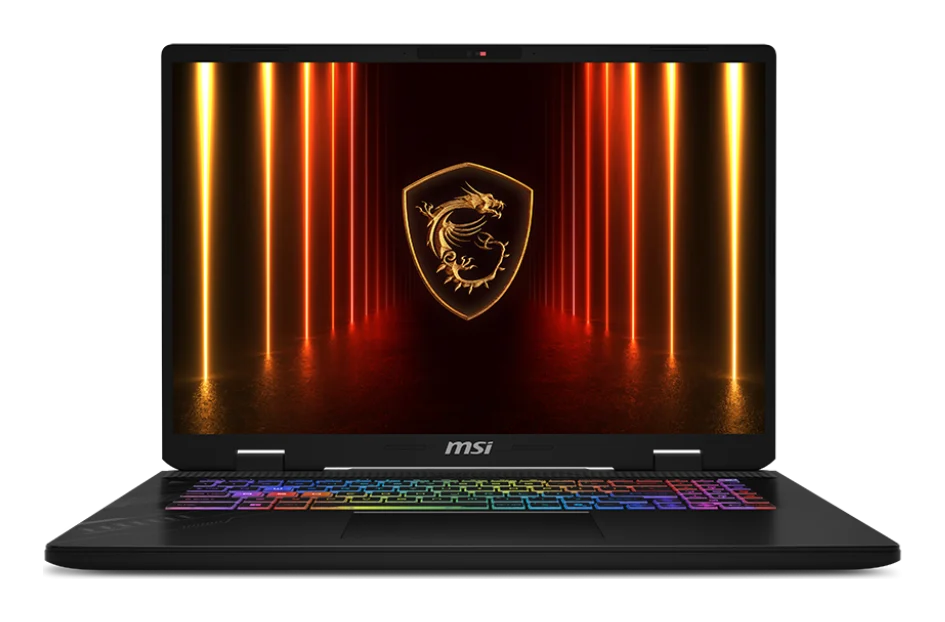
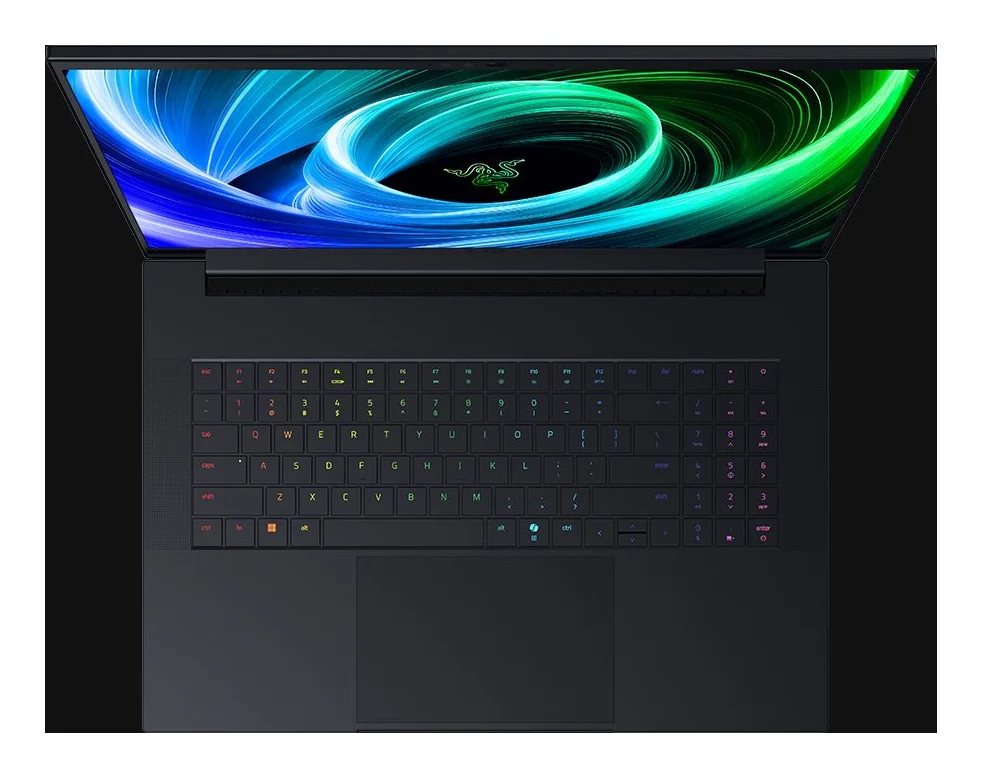
InnoReviews verdict
This one is close to a dead heat: MSI Crosshair 17 HX AI D2XW scores 66.6 against 66.1 for Razer Blade 18 (2025). Pick by the categories that matter to you, or by price.
Key differences
Reasons to pick the MSI Crosshair 17 HX AI D2XW
- 10% lower weight: 2.8 kg vs 3.1 kg
Reasons to pick the Razer Blade 18 (2025)
- 28% higher 3DMark Time Spy Graphics (GPU): 17,434 vs 13,644
- Stronger performance score: 66 vs 60
- 100% higher RAM: 32 GB vs 16 GB
- 67% higher charging: 400 W vs 240 W
- 10% higher capacity: 99 Wh vs 90 Wh
Which would you pick?
MSI Crosshair 17 HX AI D2XW vs Razer Blade 18 (2025): full specs
Display
| Spec | MSI Crosshair 17 HX AI D2XW | Razer Blade 18 (2025) |
|---|---|---|
| Screen size | 17 ″ | 18 ″+6% |
| Panel type | IPS | IPS |
| Resolution | 2560x1600 | 3840x2400 |
| Refresh rate | 240 Hz | 240 Hz |
| Peak brightness | — | 500 nits |
Performance
| Spec | MSI Crosshair 17 HX AI D2XW | Razer Blade 18 (2025) |
|---|---|---|
| Processor | Intel Core Ultra 9 275HX | Intel Core Ultra 9 275HX |
| Graphics | NVIDIA GeForce RTX 5070 Laptop GPU (8GB GDDR7) | NVIDIA GeForce RTX 5070 Ti Laptop |
| RAM | 16 GB | 32 GB+100% |
| RAM type | DDR5 | DDR5-5600 SO-DIMM (2 slots) |
| Storage | 1,024 GB | 1,024 GB |
| Storage type | NVMe SSD PCIe Gen4 | PCIe 4.0 NVMe SSD (2 slots) |
Benchmarks
| Spec | MSI Crosshair 17 HX AI D2XW | Razer Blade 18 (2025) |
|---|---|---|
| Geekbench 6 (single) | — | 3,127Top 12% |
| Geekbench 6 (multi) | — | 20,220Top 9% |
| 3DMark Time Spy Graphics (GPU) | 13,644Top 31% | 17,434+28%Top 21% |
Battery
| Spec | MSI Crosshair 17 HX AI D2XW | Razer Blade 18 (2025) |
|---|---|---|
| Capacity | 90 Wh | 99 Wh+10% |
| Charging | 240 W | 400 W+67% |
Design
| Spec | MSI Crosshair 17 HX AI D2XW | Razer Blade 18 (2025) |
|---|---|---|
| Weight | 2.8 kg+10% | 3.1 kg |
| Thickness | 29.7 mm | 27.9 mm+6% |
| Material | — | CNC aluminum (recycled) |
Connectivity
| Spec | MSI Crosshair 17 HX AI D2XW | Razer Blade 18 (2025) |
|---|---|---|
| Ports | 3x USB-A 3.2 Gen1, 1x Thunderbolt 4 (DisplayPort, Power Delivery 3.0), HDMI 2.1, Gigabit Ethernet, 3.5mm combo jack | 1x Thunderbolt 5, 1x Thunderbolt 4, 3x USB-A 3.2 Gen 2, HDMI 2.1, 2.5G Ethernet, SD (UHS-II), 3.5mm |
| Wi-Fi | Wi-Fi 6E | Wi-Fi 7 |
| Bluetooth | — | 5.4 |
| Webcam | 720p HD with shutter | 5MP + IR |
| Biometrics | None | IR face (Windows Hello) |
Software
| Spec | MSI Crosshair 17 HX AI D2XW | Razer Blade 18 (2025) |
|---|---|---|
| Operating system | Windows 11 Home | Windows 11 |
Quick answers
Which is better: MSI Crosshair 17 HX AI D2XW or Razer Blade 18 (2025)?
This one is close to a dead heat: MSI Crosshair 17 HX AI D2XW scores 66.6 against 66.1 for Razer Blade 18 (2025). Pick by the categories that matter to you, or by price.
How do the scores compare?
MSI Crosshair 17 HX AI D2XW scores 66.6/100 overall; Razer Blade 18 (2025) scores 66.1/100. MSI Crosshair 17 HX AI D2XW wins 1 individual spec rows, Razer Blade 18 (2025) wins 6.
What are the main differences between the MSI Crosshair 17 HX AI D2XW and the Razer Blade 18 (2025)?
MSI Crosshair 17 HX AI D2XW advantages: 10% lower weight: 2.8 kg vs 3.1 kg. Razer Blade 18 (2025) advantages: 28% higher 3DMark Time Spy Graphics (GPU): 17,434 vs 13,644; Stronger performance score: 66 vs 60; 100% higher RAM: 32 GB vs 16 GB; 67% higher charging: 400 W vs 240 W; 10% higher capacity: 99 Wh vs 90 Wh.
Use this on your site or forum
Copy a ready-made link. Scores on this page update as new results are published, so the link always leads to the current figures.