iPhone 11 vs Samsung Galaxy S10
iPhone 11: Apple A13 Bionic, released Sep 20, 2019, $699
Samsung Galaxy S10: Samsung Exynos 9820, released Mar 8, 2019, $899
The iPhone 11 is 6 months newer.
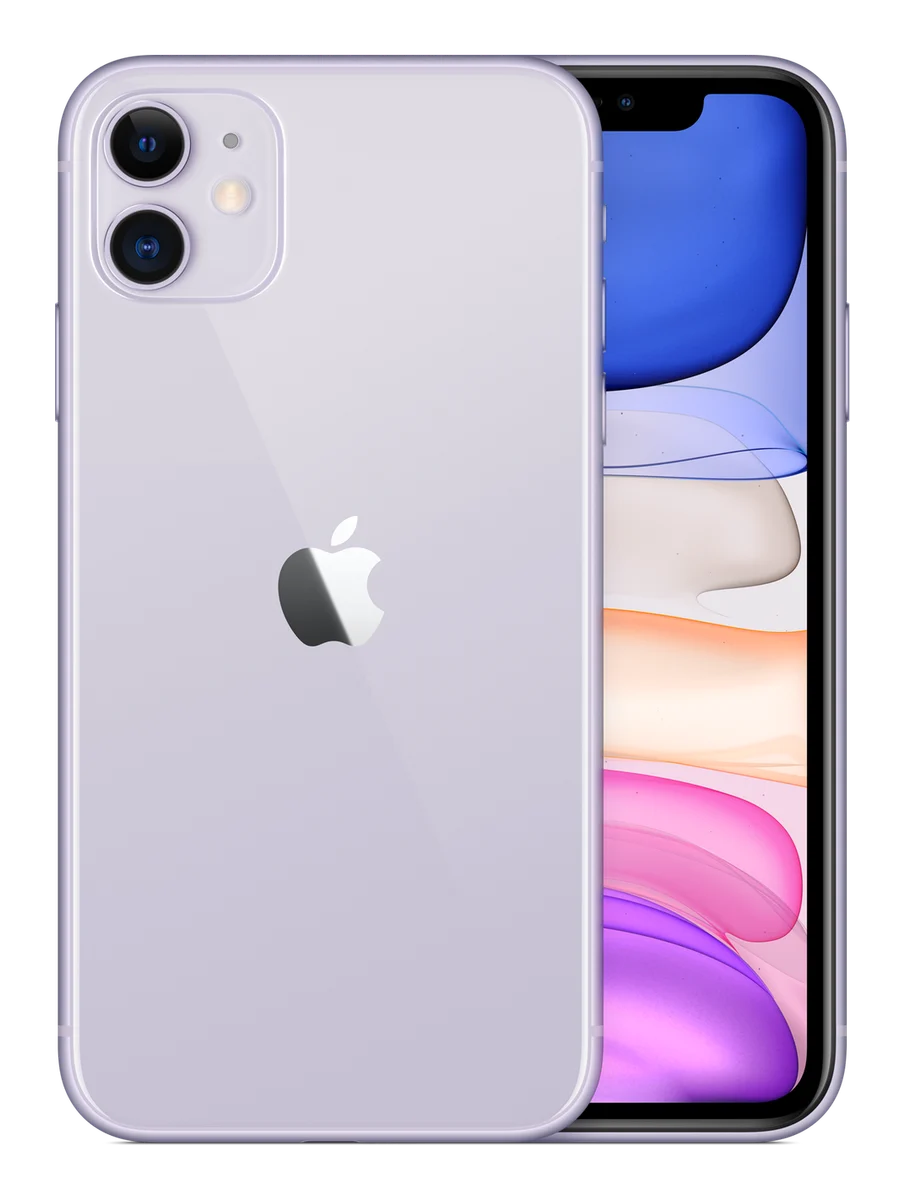
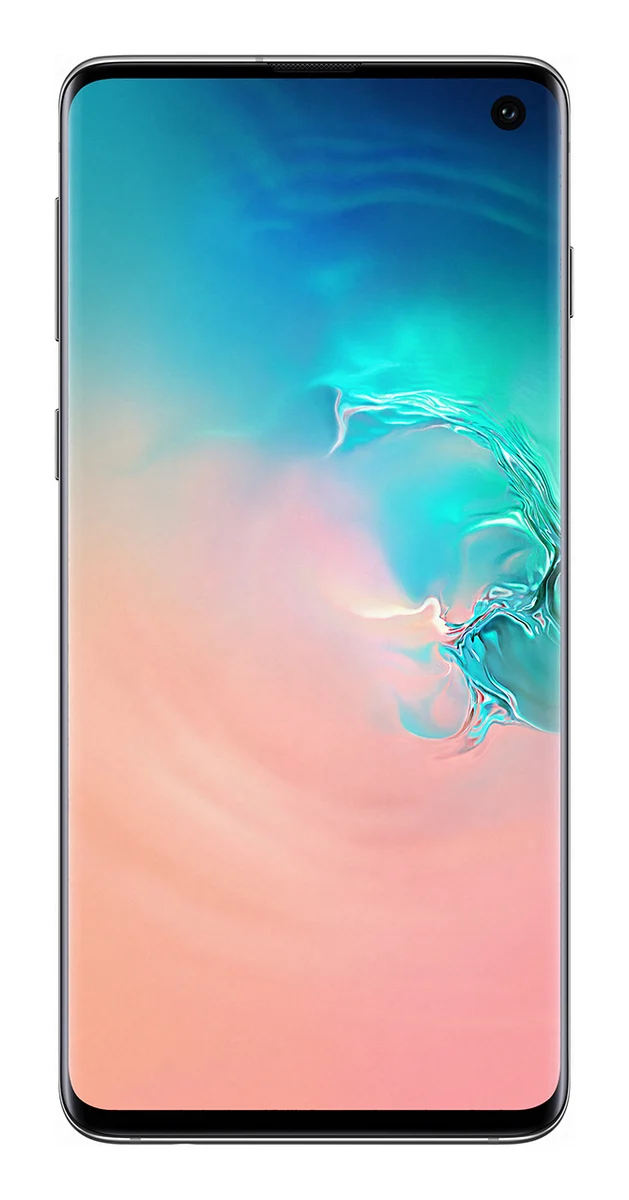
InnoReviews verdict
This one is close to a dead heat: iPhone 11 scores 36.7 against 37.1 for Samsung Galaxy S10. Pick by the categories that matter to you, or by price.
Key differences
Reasons to pick the iPhone 11
- Stronger performance score: 46 vs 41
- 100% higher OS update pledge: 6 years vs 3 years
- 20% higher front camera: 12 MP vs 10 MP
- 20% higher wired charging: 18 W vs 15 W
- Has eSIM — the other doesn't
- Lower launch price: $699 vs $899
Reasons to pick the Samsung Galaxy S10
- 100% higher RAM (max): 8 GB vs 4 GB
- 100% higher wireless charging: 15 W vs 7.5 W
- 69% higher pixel density: 550 ppi vs 326 ppi
- 33% higher ultra-wide: 16 MP vs 12 MP
- 28% higher peak brightness: 800 nits vs 625 nits
Which would you pick?
iPhone 11 vs Samsung Galaxy S10: full specs
Display
| Spec | iPhone 11 | Samsung Galaxy S10 |
|---|---|---|
| Screen size | 6.1 ″ | 6.1 ″ |
| Panel type | IPS LCD | AMOLED |
| Resolution | 1792x828 | 3040x1440 |
| Pixel density | 326 ppi | 550 ppi+69% |
| Refresh rate | 60 Hz | 60 Hz |
| Peak brightness | 625 nits | 800 nits+28% |
Performance
| Spec | iPhone 11 | Samsung Galaxy S10 |
|---|---|---|
| Chipset | Apple A13 Bionic | Samsung Exynos 9820 |
| AnTuTu | 950,615Bottom 22% | — |
| AnTuTu 11 (CPU) | 221,262Bottom 6% | — |
| AnTuTu 11 (GPU) | 282,641Bottom 29% | — |
| AnTuTu 11 (Memory) | 137,639Bottom 5% | — |
| AnTuTu 11 (UX) | 309,073Bottom 28% | — |
| AnTuTu 12 | — | 796,603Bottom 11% |
| RAM (max) | 4 GB | 8 GB+100% |
| Storage options | 64GB / 128GB / 256GB | 128GB / 512GB |
| Storage type | NVMe | UFS 2.1 |
Camera
| Spec | iPhone 11 | Samsung Galaxy S10 |
|---|---|---|
| Main camera | 12 MP | 12 MP |
| Main aperture | f/1.8 | f/1.5-2.4 |
| Ultra-wide | 12 MP | 16 MP+33% |
| Telephoto | — | 12 MP |
| Optical zoom | — | 2 x |
| Max video | 4K@60fps | 4K@60fps |
| Front camera | 12 MP+20% | 10 MP |
| OIS | Yes | Yes |
Battery
| Spec | iPhone 11 | Samsung Galaxy S10 |
|---|---|---|
| Capacity | 3,110 mAh | 3,400 mAh+9% |
| Wired charging | 18 W+20% | 15 W |
| Wireless charging | 7.5 W | 15 W+100% |
Design
| Spec | iPhone 11 | Samsung Galaxy S10 |
|---|---|---|
| Weight | 194 g | 157 g+19% |
| Thickness | 8.3 mm | 7.8 mm+6% |
| IP rating | IP68 | IP68 |
| Frame material | Aluminum | Aluminum |
Connectivity
| Spec | iPhone 11 | Samsung Galaxy S10 |
|---|---|---|
| 5G | No | No |
| Wi-Fi | Wi-Fi 6 | Wi-Fi 6 |
| Bluetooth | 5.0 | 5.0 |
| NFC | Yes | Yes |
| USB | Lightning | USB-C 3.1 |
| eSIM | Yes | No |
Software
| Spec | iPhone 11 | Samsung Galaxy S10 |
|---|---|---|
| OS at launch | iOS 13 | Android 9 (One UI) |
| OS update pledge | 6 years+100% | 3 years |
Audio
| Spec | iPhone 11 | Samsung Galaxy S10 |
|---|---|---|
| Stereo speakers | Yes | Yes |
| 3.5mm jack | No | Yes |
Quick answers
Which is better: iPhone 11 or Samsung Galaxy S10?
This one is close to a dead heat: iPhone 11 scores 36.7 against 37.1 for Samsung Galaxy S10. Pick by the categories that matter to you, or by price.
How do the scores compare?
iPhone 11 scores 36.7/100 overall; Samsung Galaxy S10 scores 37.1/100. iPhone 11 wins 4 individual spec rows, Samsung Galaxy S10 wins 9.
What are the main differences between the iPhone 11 and the Samsung Galaxy S10?
iPhone 11 advantages: Stronger performance score: 46 vs 41; 100% higher OS update pledge: 6 years vs 3 years; 20% higher front camera: 12 MP vs 10 MP; 20% higher wired charging: 18 W vs 15 W; Has eSIM — the other doesn't; Lower launch price: $699 vs $899. Samsung Galaxy S10 advantages: 100% higher RAM (max): 8 GB vs 4 GB; 100% higher wireless charging: 15 W vs 7.5 W; 69% higher pixel density: 550 ppi vs 326 ppi; 33% higher ultra-wide: 16 MP vs 12 MP; 28% higher peak brightness: 800 nits vs 625 nits.
Which is cheaper: iPhone 11 or Samsung Galaxy S10?
iPhone 11 launched cheaper at $699, versus $899 for the Samsung Galaxy S10.
Use this on your site or forum
Copy a ready-made link. Scores on this page update as new results are published, so the link always leads to the current figures.