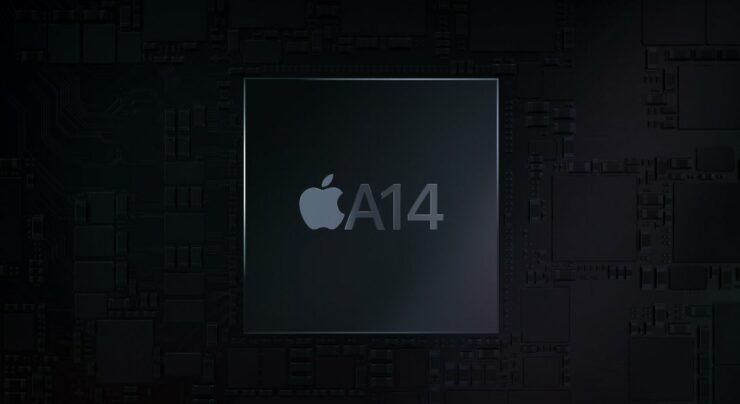
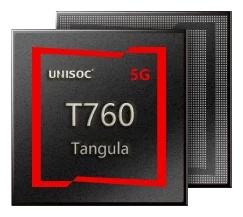
Apple A14 Bionic vs Unisoc Tiger T760
46CPU24.6
35.1GPU22
53.6Benchmarks33.1
41.1AIspec-based—
63.2Efficiencyspec-based54.9
7 spec wins — Apple A14 Bionic3 spec wins — Unisoc Tiger T760
InnoReviews verdict
Apple A14 Bionic wins this mobile chipset face-off, 46.9 to 30.8, pulling ahead mainly in CPU (+21) and benchmarks (+21). Unisoc Tiger T760 still makes sense if its price or standout specs fit your needs better.
Which would you pick?
Key differences
Reasons to pick the Apple A14 Bionic
- Stronger CPU score: 46 vs 25
- Stronger GPU score: 35 vs 22
- Stronger benchmarks score: 54 vs 33
- 363% higher 3DMark Wild Life Extreme: 2,050 vs 443
- 182% higher Geekbench 6 (single): 2,080 vs 738
Reasons to pick the Unisoc Tiger T760
- 33% higher cores: 8 vs 6
- 17% lower TDP (typical): 5 W vs 6 W
General
| Spec | Apple A14 Bionic | Unisoc Tiger T760 |
|---|---|---|
| Announced | 2020 | 2022 |
| Process | 5 nm+17% | 6 nm |
| TDP (typical) | 6 W | 5 W+17% |
| Architecture | Armv8.4 | Armv8.2 |
CPU
| Spec | Apple A14 Bionic | Unisoc Tiger T760 |
|---|---|---|
| Cores | 6 | 8+33% |
| Core configuration | 2x3.0 GHz + 4x1.82 GHz | 4x2.2 GHz Cortex-A76 + 4x2.0 GHz Cortex-A55 |
| Max clock | 3 GHz+36% | 2.2 GHz |
GPU
| Spec | Apple A14 Bionic | Unisoc Tiger T760 |
|---|---|---|
| GPU | Apple GPU (4-core) | Arm Mali-G57 MP4 |
AI
| Spec | Apple A14 Bionic | Unisoc Tiger T760 |
|---|---|---|
| NPU | 16-core Neural Engine | — |
| AI performance | 11 TOPS | — |
Memory
| Spec | Apple A14 Bionic | Unisoc Tiger T760 |
|---|---|---|
| Memory type | LPDDR4X-4266 | LPDDR4X-2133 |
| Max bandwidth | 34.1 GB/s+99% | 17.1 GB/s |
Connectivity
| Spec | Apple A14 Bionic | Unisoc Tiger T760 |
|---|---|---|
| Modem | External (Snapdragon X55) | Integrated 5G (sub-6) |
| Wi-Fi | — | Wi-Fi 6 |
| Bluetooth | — | 5.2 |
Media
| Spec | Apple A14 Bionic | Unisoc Tiger T760 |
|---|---|---|
| Max display | — | FHD+ @ 120Hz |
| Video capture | 4K@60fps | 4K@30fps |
Benchmarks
| Spec | Apple A14 Bionic | Unisoc Tiger T760 |
|---|---|---|
| AnTuTu | 950,000+126% | 420,000 |
| Geekbench 6 (single) | 2,080+182%Top 15% | 738Bottom 29% |
| Geekbench 6 (multi) | 4,900+126%Top 22% | 2,168Bottom 39% |
| 3DMark Wild Life Extreme | 2,050+363%Top 34% | 443Bottom 24% |
Related comparisons
Apple A14 Bionicvs Samsung Exynos 2200VSApple A14 Bionicvs Qualcomm Snapdragon 7+ Gen 2VSApple A14 Bionicvs Qualcomm Snapdragon 888VSApple A14 Bionicvs MediaTek Dimensity 8200VSUnisoc Tiger T760vs Qualcomm Snapdragon 695VSUnisoc Tiger T760vs Qualcomm Snapdragon 730GVSUnisoc Tiger T760vs Huawei Kirin 8000VSUnisoc Tiger T760vs MediaTek Dimensity 6080VS