Huawei Kirin T82B vs Unisoc T7300
Huawei Kirin T82B: released Jul 10, 2025
Unisoc T7300: released Jul 22, 2025
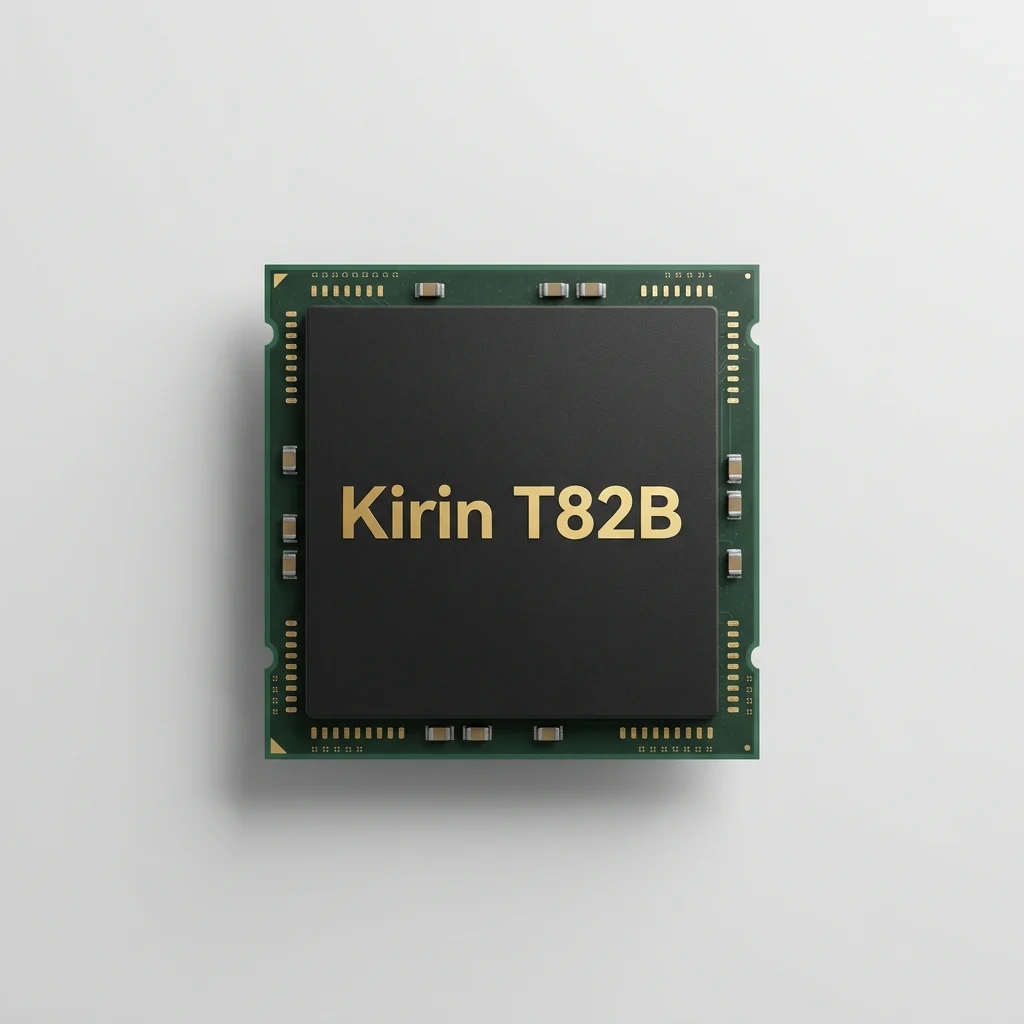
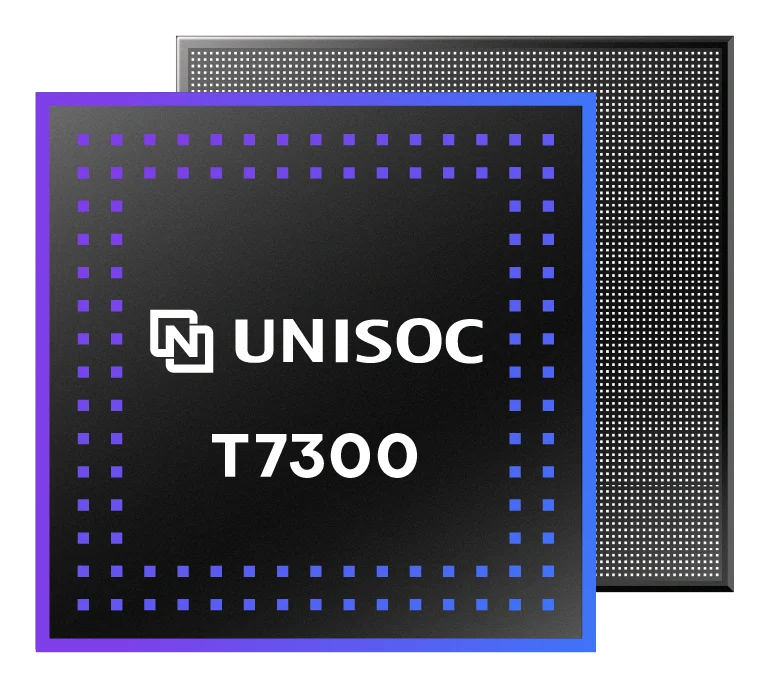
InnoReviews verdict
Huawei Kirin T82B wins this mobile chipset face-off, 36.6 to 34.7, pulling ahead mainly in benchmarks (+12) and CPU (+8).
Key differences
Reasons to pick the Huawei Kirin T82B
- 154% higher 3DMark Wild Life Extreme: 903 vs 355
- 79% higher Geekbench 6 (multi): 3,782 vs 2,111
- 47% higher Geekbench 6 (single): 1,311 vs 893
- Stronger benchmarks score: 55 vs 44
Reasons to pick the Unisoc T7300
No decisive spec advantages over the other side.
Huawei Kirin T82B vs Unisoc T7300: benchmarks
Published results for both, side by side
Geekbench 6 (single)
- Huawei Kirin T82B1,311
- Unisoc T7300893
Published results: review runs where we found them, otherwise typical published figures. A chip's figure is normally the median of review runs on devices with that chip.
Geekbench 6 (multi)
- Huawei Kirin T82B3,782
- Unisoc T73002,111
Published results: review runs where we found them, otherwise typical published figures. A chip's figure is normally the median of review runs on devices with that chip.
3DMark Wild Life Extreme
- Huawei Kirin T82B903
- Unisoc T7300355
Published 3DMark results (Wild Life Extreme for chips, the Time Spy Graphics score for graphics cards): review runs where we found them, otherwise typical published figures.
Not drawn side by side, because only one device has a published result or the two come from different versions:
- AnTuTu 11: Huawei Kirin T82B 1,006,730; AnTuTu (typical): Unisoc T7300 637,199
Which would you pick?
Huawei Kirin T82B vs Unisoc T7300: full specs
General
| Spec | Huawei Kirin T82B | Unisoc T7300 |
|---|---|---|
| Announced | 2025 | 2025 |
| Process | — | 6 nm |
| Architecture | ARM | Armv8.2 |
CPU
| Spec | Huawei Kirin T82B | Unisoc T7300 |
|---|---|---|
| Cores | 8 | 8 |
| Core configuration | 1x2.29 GHz Big + 3x2.05 GHz Mid + 4x1.31 GHz Little | 2x2.2 GHz Cortex-A78 + 6x2.0 GHz Cortex-A55 |
| Max clock | 2.29 GHz+4% | 2.2 GHz |
GPU
| Spec | Huawei Kirin T82B | Unisoc T7300 |
|---|---|---|
| GPU | HiSilicon Maleoon 920c | Arm Mali-G57 MC2 |
| GPU clock | — | 950 MHz |
Memory
| Spec | Huawei Kirin T82B | Unisoc T7300 |
|---|---|---|
| Memory type | — | LPDDR4X-2133 |
Connectivity
| Spec | Huawei Kirin T82B | Unisoc T7300 |
|---|---|---|
| Modem | — | Integrated LTE Cat-7 (DL) / Cat-13 (UL) |
| Wi-Fi | Wi-Fi 6 | Wi-Fi 5 (Wi-Fi 6 optional) |
| Bluetooth | 5.2 | 5.4 |
Media
| Spec | Huawei Kirin T82B | Unisoc T7300 |
|---|---|---|
| Max display | — | FHD+ @ 120Hz |
| Video capture | — | 2K@30fps |
Benchmarks
| Spec | Huawei Kirin T82B | Unisoc T7300 |
|---|---|---|
| AnTuTuDifferent AnTuTu versions — not compared | 1,006,730Bottom 49% | 637,199 |
| AnTuTu 11 (CPU) | 448,941Top 41% | — |
| AnTuTu 11 (GPU) | 135,631Bottom 39% | — |
| AnTuTu 11 (Memory) | 197,783Top 48% | — |
| AnTuTu 11 (UX) | 224,375Bottom 29% | — |
| AnTuTu 12 | 1,154,625Top 50% | — |
| Geekbench 6 (single) | 1,311+47%Top 38% | 893Bottom 32% |
| Geekbench 6 (multi) | 3,782+79%Top 39% | 2,111Bottom 32% |
| 3DMark Wild Life Extreme | 903+154%Top 48% | 355Bottom 28% |
Quick answers
Which is better: Huawei Kirin T82B or Unisoc T7300?
Huawei Kirin T82B wins this mobile chipset face-off, 36.6 to 34.7, pulling ahead mainly in benchmarks (+12) and CPU (+8).
How do the scores compare?
Huawei Kirin T82B scores 36.6/100 overall; Unisoc T7300 scores 34.7/100. Huawei Kirin T82B wins 4 individual spec rows, Unisoc T7300 wins 0.
What are the main differences between the Huawei Kirin T82B and the Unisoc T7300?
Huawei Kirin T82B advantages: 154% higher 3DMark Wild Life Extreme: 903 vs 355; 79% higher Geekbench 6 (multi): 3,782 vs 2,111; 47% higher Geekbench 6 (single): 1,311 vs 893; Stronger benchmarks score: 55 vs 44.
Use this on your site or forum
Copy a ready-made link. Scores on this page update as new results are published, so the link always leads to the current figures.