| 201 | 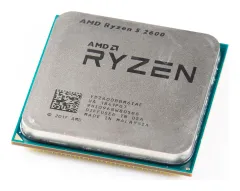 AMD Ryzen 5 2600AMD · 2018 | 31.0 | 22 | 32 | 41 | 13 120 | 6 / 12 | $199 |
| 202 | 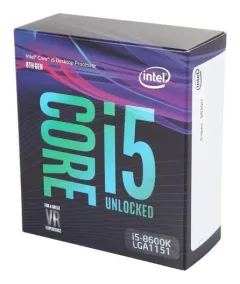 Intel Core i5-8600KIntel · 2017 | 30.8 | 34 | 30 | 29 | 10 133 | 6 / 6 | $257 |
| 203 |  Intel Core i5-9500Intel · 2019 | 30.3 | 34 | 28 | 30 | 9 842 | 6 / 6 | $192 |
| 204 |  Intel Core i5-8600Intel · 2018 | 30.2 | 34 | 28 | 29 | 9 993 | 6 / 6 | — |
| 205 | 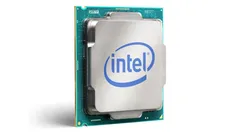 Intel Core i7-7700KIntel · 2017 | 29.8 | 35 | 28 | 28 | 9 634 | 4 / 8 | $339 |
| 206 |  Intel Core i3-10105FIntel · 2021 | 29.7 | 36 | 27 | 27 | 8 860 | 4 / 8 | $107 |
| 207 | 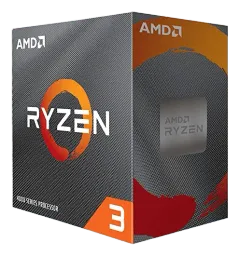 AMD Ryzen 3 4100AMD · 2022 | 29.4 | 33 | 30 | 24 | 11 027 | 4 / 8 | $99 |
| 208 | 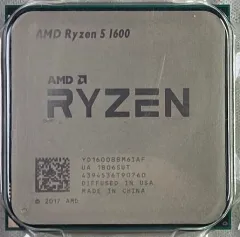 AMD Ryzen 5 1600AMD · 2017 | 29.4 | 21 | 30 | 39 | 12 242 | 6 / 12 | $219 |
| 209 |  Intel Pentium Gold G7400Intel · 2022 | 29.3 | 45 | 24 | 20 | 6 701 | 2 / 4 | — |
| 210 |  Intel Core i5-10500TIntel · 2020 | 29.2 | 27 | 29 | 33 | 10 236 | 6 / 12 | $192 |
| 211 | Intel Core i3-10105Intel · 2021 | 29.1 | 35 | 26 | 27 | 8 284 | 4 / 8 | $134 |
| 212 | Intel Core i3-10100Intel · 2020 | 28.9 | 35 | 26 | 26 | 8 470 | 4 / 8 | $134 |
| 213 | Intel Core i3-10100FIntel · 2020 | 28.9 | 33 | 28 | 26 | 8 702 | 4 / 8 | — |
| 214 | Intel Core i5-8400Intel · 2017 | 28.9 | 31 | 29 | 27 | 9 235 | 6 / 6 | $182 |
| 215 | 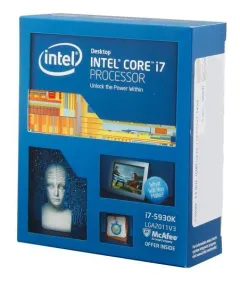 Intel Core i7-5930KIntel · 2014 | 28.9 | 20 | 30 | 38 | 10 335 | 6 / 12 | $583 |
| 216 | Intel Core i5-8500Intel · 2018 | 28.6 | 31 | 28 | 28 | 9 499 | 6 / 6 | $192 |
| 217 | Intel Core i5-9400Intel · 2019 | 28.4 | 30 | 28 | 28 | 9 350 | 6 / 6 | $182 |
| 218 | 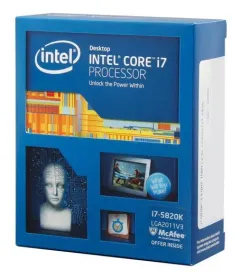 Intel Core i7-5820KIntel · 2014 | 28.4 | 20 | 29 | 37 | 9 831 | 6 / 12 | $389 |
| 219 |  AMD Ryzen 3 4300GAMD · 2020 | 28.3 | 31 | 28 | 24 | 10 088 | 4 / 8 | — |
| 220 | 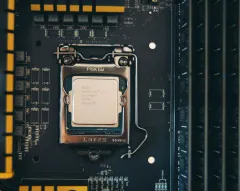 Intel Core i7-4790KIntel · 2014 | 27.9 | 32 | 26 | 27 | 8 062 | 4 / 8 | $339 |
| 221 | Intel Core i5-9400FIntel · 2019 | 27.8 | 27 | 28 | 28 | 9 463 | 6 / 6 | $157 |
| 222 | 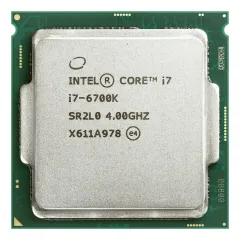 Intel Core i7-6700KIntel · 2015 | 27.7 | 31 | 27 | 26 | 8 933 | 4 / 8 | $339 |
| 223 |  Intel Core i7-7700Intel · 2017 | 27.7 | 31 | 27 | 26 | 8 639 | 4 / 8 | — |
| 224 | 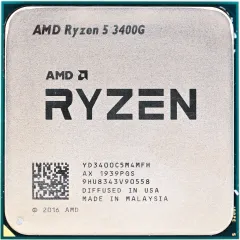 AMD Ryzen 5 3400GAMD · 2019 | 26.9 | 28 | 27 | 26 | 9 151 | 4 / 8 | $149 |
| 225 | 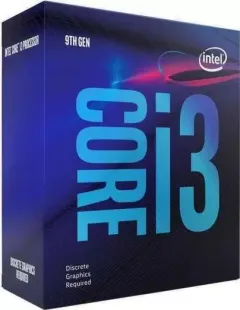 Intel Core i3-9100FIntel · 2019 | 26.9 | 32 | 24 | 26 | 6 704 | 4 / 4 | — |
| 226 | 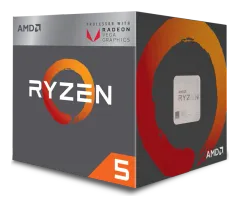 AMD Ryzen 5 2400GAMD · 2018 | 26.0 | 28 | 26 | 24 | 8 707 | 4 / 8 | $169 |
| 227 | 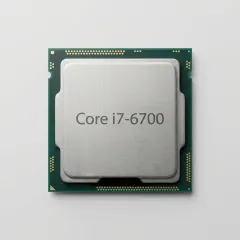 Intel Core i7-6700Intel · 2015 | 25.8 | 27 | 26 | 24 | 8 033 | 4 / 8 | $303 |
| 228 | 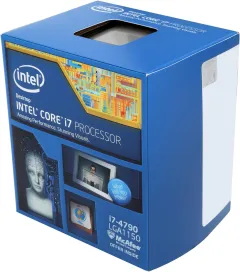 Intel Core i7-4790Intel · 2014 | 25.7 | 27 | 26 | 24 | 7 257 | 4 / 8 | $303 |
| 229 | 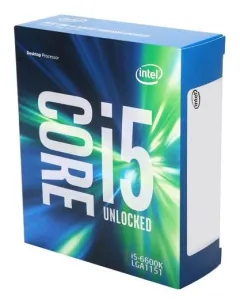 Intel Core i5-6600KIntel · 2015 | 25.5 | 28 | 25 | 24 | 6 311 | 4 / 4 | $242 |
| 230 | 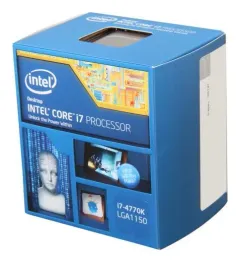 Intel Core i7-4770KIntel · 2013 | 24.8 | 25 | 25 | 24 | 7 150 | 4 / 8 | $339 |
| 231 | 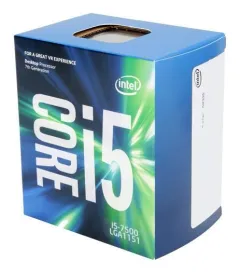 Intel Core i5-7500Intel · 2017 | 24.6 | 26 | 24 | 23 | 6 041 | 4 / 4 | $192 |
| 232 | 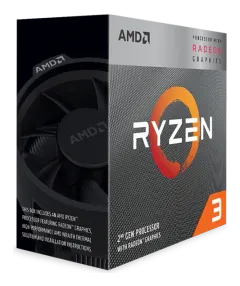 AMD Ryzen 3 3200GAMD · 2019 | 24.4 | 24 | 25 | 24 | 6 970 | 4 / 4 | $99 |
| 233 | 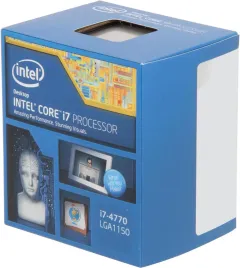 Intel Core i7-4770Intel · 2013 | 23.8 | 21 | 26 | 24 | 7 067 | 4 / 8 | $303 |
| 234 |  Intel Core i5-4690KIntel · 2014 | 23.7 | 24 | 24 | 24 | 5 680 | 4 / 4 | $242 |
| 235 |  Intel Pentium Gold G6400Intel · 2020 | 23.6 | 31 | 21 | 20 | 4 065 | 2 / 4 | $77 |
| 236 | 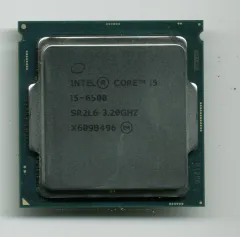 Intel Core i5-6500Intel · 2015 | 23.5 | 26 | 23 | 22 | 5 599 | 4 / 4 | $192 |
| 237 | 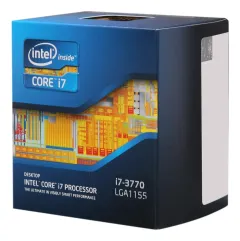 Intel Core i7-3770Intel · 2012 | 23.5 | 22 | 25 | 24 | 6 412 | 4 / 8 | $294 |
| 238 | 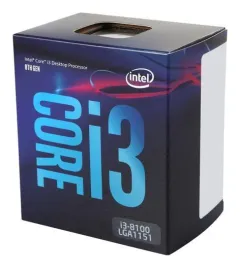 Intel Core i3-8100Intel · 2017 | 23.3 | 25 | 23 | 22 | 6 053 | 4 / 4 | $117 |
| 239 | 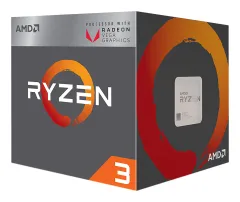 AMD Ryzen 3 2200GAMD · 2018 | 22.7 | 21 | 24 | 23 | 6 698 | 4 / 4 | $99 |
| 240 |  Intel Core i5-4670KIntel · 2013 | 22.7 | 21 | 24 | 23 | 5 590 | 4 / 4 | $242 |
| 241 | 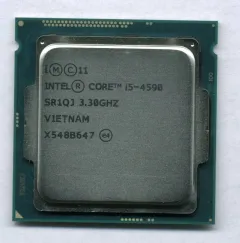 Intel Core i5-4590Intel · 2014 | 22.1 | 20 | 23 | 23 | 5 380 | 4 / 4 | $192 |
| 242 |  Intel Core i5-7400Intel · 2017 | 22.0 | 22 | 23 | 21 | 5 482 | 4 / 4 | $182 |
| 243 | 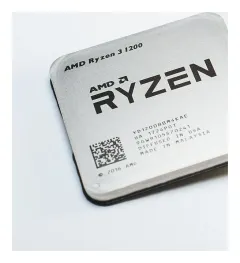 AMD Ryzen 3 1200AMD · 2017 | 21.8 | 20 | 24 | 21 | 6 271 | 4 / 4 | $109 |
| 244 | 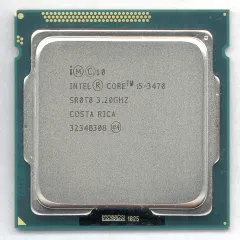 Intel Core i5-3470Intel · 2012 | 21.2 | 20 | 22 | 22 | 4 655 | 4 / 4 | $184 |
| 245 | 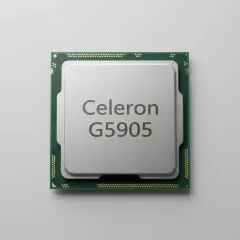 Intel Celeron G5905Intel · 2020 | 21.1 | 24 | 20 | 20 | 2 764 | 2 / 2 | — |
| 246 | 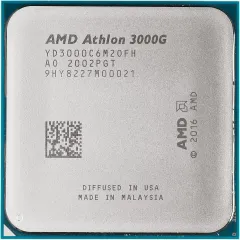 AMD Athlon 3000GAMD · 2019 | 20.6 | 20 | 21 | 20 | 4 436 | 2 / 4 | $49 |
| 247 | 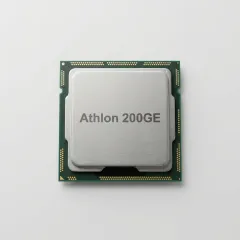 AMD Athlon 200GEAMD · 2018 | 20.4 | 20 | 21 | 20 | 4 101 | 2 / 4 | $55 |
| 248 | 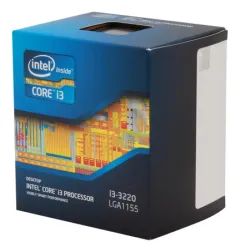 Intel Core i3-3220Intel · 2012 | 20.2 | 20 | 20 | 20 | 2 278 | 2 / 4 | $117 |
| 249 | 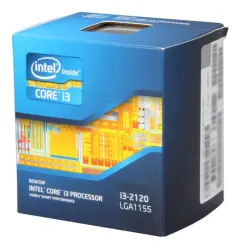 Intel Core i3-2120Intel · 2011 | 20.0 | 20 | 20 | 20 | 1 972 | 2 / 4 | $138 |