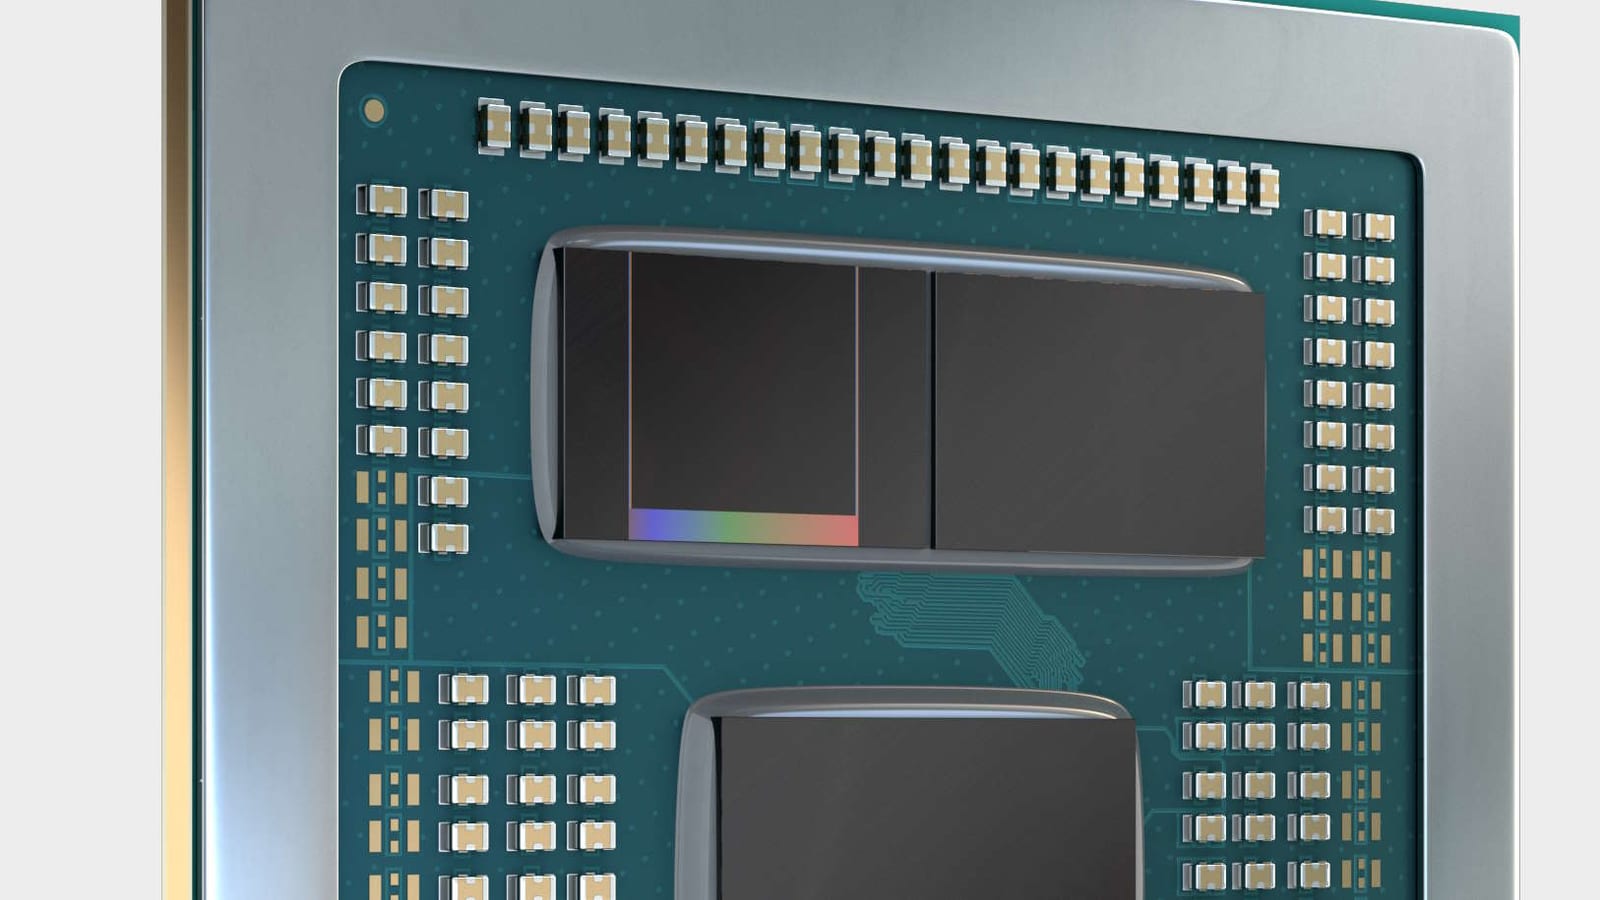
AMD Ryzen 9 7945HX vs Intel Core i9-13900HX
68Single-core70
75.5Multi-core68.7
40Efficiencyspec-based28.9
32iGPU—
75.4Platformspec-based78
9 spec wins — AMD Ryzen 9 7945HX4 spec wins — Intel Core i9-13900HX
InnoReviews verdict
This one is close to a dead heat: AMD Ryzen 9 7945HX scores 63.9 against 64 for Intel Core i9-13900HX. Pick by the categories that matter to you — Intel Core i9-13900HX edges ahead in single-core, or by price.
Which would you pick?
Key differences
Reasons to pick the AMD Ryzen 9 7945HX
- Stronger multi-core score: 76 vs 69
- 100% higher Performance cores: 16 vs 8
- 78% higher L3 cache: 64 MB vs 36 MB
- 50% lower process: 5 nm vs 10 nm
- 30% higher PassMark: 53,778 vs 41,321
Reasons to pick the Intel Core i9-13900HX
- 200% higher Max memory: 192 GB vs 64 GB
- 109% higher Max TDP: 157 W vs 75 W
- 50% higher cores: 24 vs 16
General
| Spec | AMD Ryzen 9 7945HX | Intel Core i9-13900HX |
|---|---|---|
| Announced | 2023 | 2023 |
| Process | 5 nm+50% | 10 nm |
| Base TDP | 55 W | 55 W |
| Max TDP | 75 W | 157 W+109% |
Cores & Clocks
| Spec | AMD Ryzen 9 7945HX | Intel Core i9-13900HX |
|---|---|---|
| Cores | 16 | 24+50% |
| Performance cores | 16+100% | 8 |
| Efficiency cores | — | 16 |
| Threads | 32 | 32 |
| Base clock | 2.5 GHz+14% | 2.2 GHz |
| Boost clock | 5.4 GHz | 5.4 GHz |
| L3 cache | 64 MB+78% | 36 MB |
Integrated GPU
| Spec | AMD Ryzen 9 7945HX | Intel Core i9-13900HX |
|---|---|---|
| iGPU | AMD Radeon 610M | Intel UHD Graphics (32 EU) |
| iGPU clock | 2,200 MHz | 1,650 MHz |
Memory
| Spec | AMD Ryzen 9 7945HX | Intel Core i9-13900HX |
|---|---|---|
| Memory support | DDR5-5200 | DDR5-5600 / DDR4-3200 |
| Max memory | 64 GB | 192 GB+200% |
Benchmarks
| Spec | AMD Ryzen 9 7945HX | Intel Core i9-13900HX |
|---|---|---|
| Geekbench 6 (single) | 2,878Top 20% | 2,871Top 22% |
| Geekbench 6 (multi) | 16,856+1%Top 13% | 16,712Top 14% |
| Cinebench R23 (single) | 1,941Top 27% | 2,057+6%Top 11% |
| Cinebench R23 (multi) | 33,773+15%Top 4% | 29,376Top 8% |
| PassMark | 53,778+30%Top 5% | 41,321Top 11% |
| PassMark (single thread) | 4,011+1%Top 24% | 3,991Top 26% |
| 3DMark Time Spy Graphics (iGPU) | 515Bottom 9% | — |
Related comparisons
AMD Ryzen 9 7945HXvs Intel Core Ultra 9 285HVSAMD Ryzen 9 7945HXvs Intel Core i9-13950HXVSAMD Ryzen 9 7945HXvs Intel Core Ultra X7 368HVSAMD Ryzen 9 7945HXvs Apple M3 Pro (12-core)VSIntel Core i9-13900HXvs Intel Core Ultra 9 285HVSIntel Core i9-13900HXvs Intel Core i9-13950HXVSIntel Core i9-13900HXvs Intel Core Ultra X7 368HVSIntel Core i9-13900HXvs AMD Ryzen AI 9 465VS