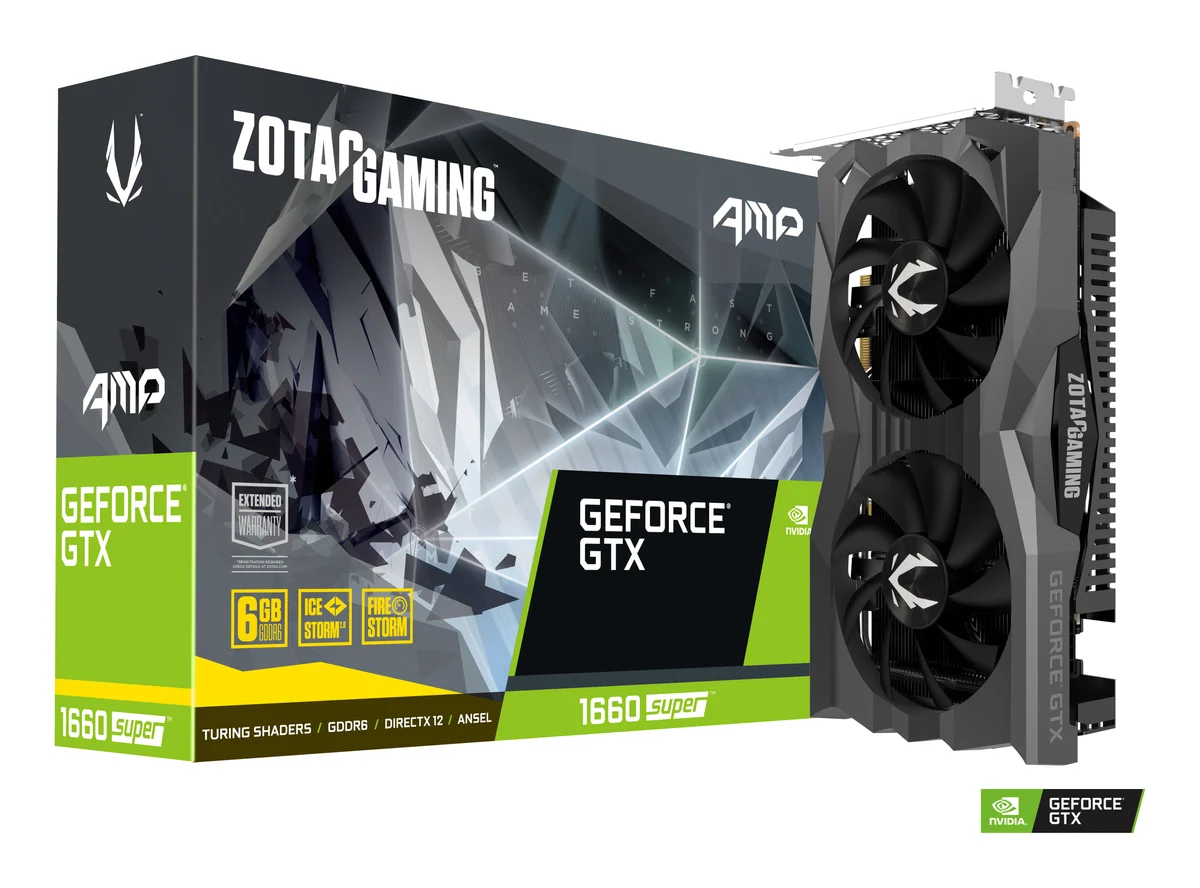
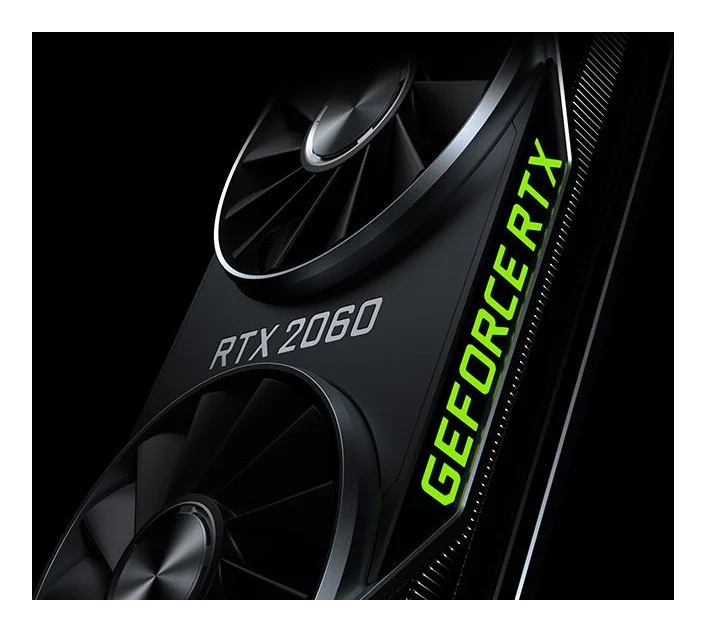
NVIDIA GeForce GTX 1660 Super vs NVIDIA GeForce RTX 2060
26.1Rasterization26.6
20Ray Tracing22.1
39.8Memoryspec-based39.8
87.7Efficiencyspec-based83.3
33.3Compute37.2
3 spec wins — NVIDIA GeForce GTX 1660 Super3 spec wins — NVIDIA GeForce RTX 2060
InnoReviews verdict
This one is close to a dead heat: NVIDIA GeForce GTX 1660 Super scores 37.2 against 37.8 for NVIDIA GeForce RTX 2060. Pick by the categories that matter to you — NVIDIA GeForce RTX 2060 edges ahead in compute and Ray Tracing, or by price.
Which would you pick?
Key differences
Reasons to pick the NVIDIA GeForce GTX 1660 Super
- 22% lower TDP: 125 W vs 160 W
- 12% higher Base clock: 1,530 MHz vs 1,365 MHz
- Lower launch price: $229 vs $349
Reasons to pick the NVIDIA GeForce RTX 2060
- Stronger compute score: 37 vs 33
- 36% higher Shading units: 1,920 vs 1,408
- 25% higher 3DMark Time Spy: 7,563 vs 6,043
- 11% higher PassMark G3D: 14,072 vs 12,655
General
| Spec | NVIDIA GeForce GTX 1660 Super | NVIDIA GeForce RTX 2060 |
|---|---|---|
| Announced | 2019 | 2019 |
| Architecture | Turing | Turing |
| Process | 12 nm | 12 nm |
| TDP | 125 W+22% | 160 W |
| Power connector | 1x 8-pin | 1x 8-pin |
Cores & Clocks
| Spec | NVIDIA GeForce GTX 1660 Super | NVIDIA GeForce RTX 2060 |
|---|---|---|
| Shading units | 1,408 | 1,920+36% |
| RT cores | — | 30 |
| Tensor / AI cores | — | 240 |
| Base clock | 1,530 MHz+12% | 1,365 MHz |
| Boost clock | 1,785 MHz+6% | 1,680 MHz |
Memory
| Spec | NVIDIA GeForce GTX 1660 Super | NVIDIA GeForce RTX 2060 |
|---|---|---|
| VRAM | 6 GB | 6 GB |
| VRAM type | GDDR6 | GDDR6 |
| Bus width | 192 bit | 192 bit |
| Bandwidth | 336 GB/s | 336 GB/s |
Benchmarks
| Spec | NVIDIA GeForce GTX 1660 Super | NVIDIA GeForce RTX 2060 |
|---|---|---|
| 3DMark Time Spy | 6,043Bottom 25% | 7,563+25%Bottom 32% |
| 3DMark Speed Way | — | 1,399Bottom 10% |
| PassMark G3D | 12,655Bottom 26% | 14,072+11%Bottom 34% |
| 1080p Ultra | — | 51 fpsBottom 5% |
| 1440p Ultra | — | 35 fpsBottom 5% |
| 4K Ultra | — | 19 fpsBottom 5% |
Features
| Spec | NVIDIA GeForce GTX 1660 Super | NVIDIA GeForce RTX 2060 |
|---|---|---|
| Upscaling | NIS (driver-level) | DLSS 4 (no FG) |
Related comparisons
NVIDIA GeForce GTX 1660 Supervs AMD Radeon RX Vega 56VSNVIDIA GeForce GTX 1660 Supervs NVIDIA GeForce GTX 1660 TiVSNVIDIA GeForce GTX 1660 Supervs NVIDIA GeForce GTX 1070 TiVSNVIDIA GeForce GTX 1660 Supervs AMD Radeon RX Vega 64VSNVIDIA GeForce RTX 2060vs NVIDIA GeForce GTX 1080VSNVIDIA GeForce RTX 2060vs NVIDIA GeForce RTX 3050VSNVIDIA GeForce RTX 2060vs AMD Radeon RX Vega 56VSNVIDIA GeForce RTX 2060vs NVIDIA GeForce GTX 1660 TiVS