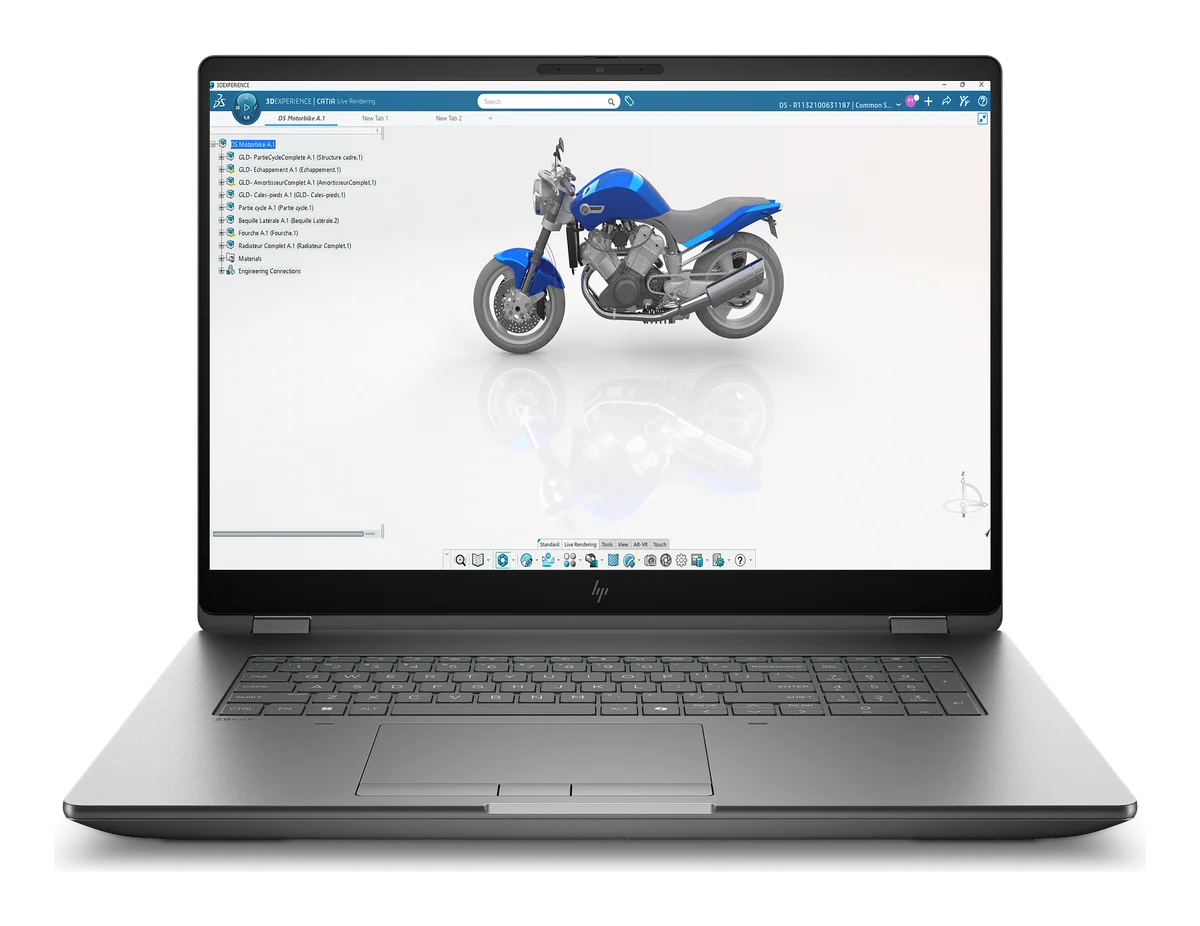
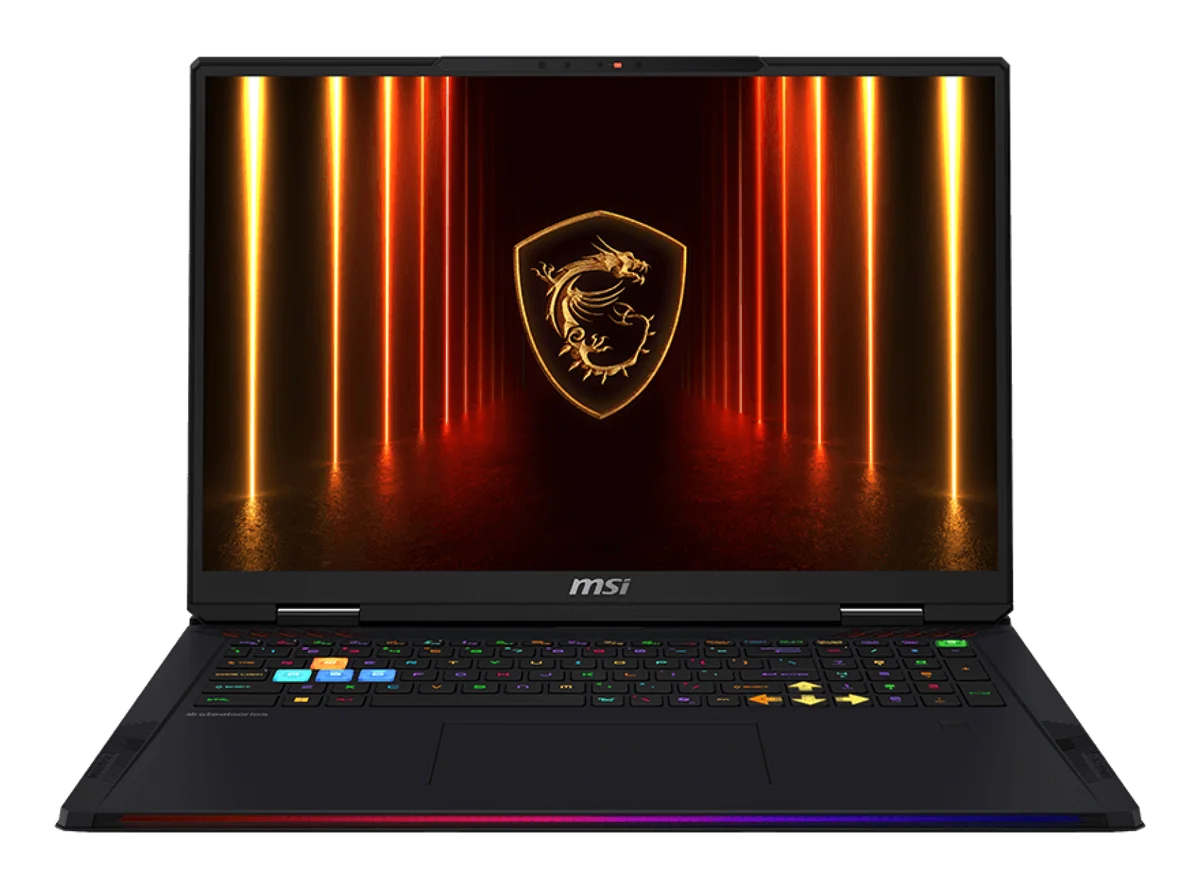
HP ZBook Fury G1i 18 vs MSI Raider A18 HX A9W
HP ZBook Fury G1i 18: Intel Core Ultra 9 285HX, released Jul 9, 2025, $3,499
MSI Raider A18 HX A9W: AMD Ryzen 9 9955HX3D, released Mar 26, 2025
The HP ZBook Fury G1i 18 is 3 months newer.
Chip vs chip: Intel Core Ultra 9 285HX vs AMD Ryzen 9 9955HX3D →
InnoReviews verdict
This one is close to a dead heat: HP ZBook Fury G1i 18 scores 57 against 56.7 for MSI Raider A18 HX A9W. Pick by the categories that matter to you, or by price.
Key differences
Reasons to pick the HP ZBook Fury G1i 18
- 286% higher web browsing endurance: 8 h vs 2.1 h
- 38% higher refresh rate: 165 Hz vs 120 Hz
- 16% lower thickness: 27 mm vs 32.1 mm
Reasons to pick the MSI Raider A18 HX A9W
- 9% higher Geekbench 6 (multi): 19,922 vs 18,285
- 78% higher peak brightness: 889 nits vs 500 nits
- 21% higher charging: 400 W vs 330 W
Which would you pick?
HP ZBook Fury G1i 18 vs MSI Raider A18 HX A9W: full specs
Display
| Spec | HP ZBook Fury G1i 18 | MSI Raider A18 HX A9W |
|---|---|---|
| Screen size | 18 ″ | 18 ″ |
| Panel type | IPS (UWVA), anti-glare | Mini-LED |
| Resolution | 2560x1600 | 3840x2400 |
| Refresh rate | 165 Hz+38% | 120 Hz |
| Peak brightness | 500 nits | 889 nits+78% |
Performance
| Spec | HP ZBook Fury G1i 18 | MSI Raider A18 HX A9W |
|---|---|---|
| Processor | Intel Core Ultra 9 285HX | AMD Ryzen 9 9955HX3D |
| Graphics | NVIDIA RTX PRO 5000 Blackwell Generation Laptop GPU (24GB GDDR7) | NVIDIA GeForce RTX 5080 Laptop GPU |
| RAM | 64 GB | 64 GB |
| RAM type | DDR5-5600 (4 SODIMM slots) | DDR5-5600 (2x SO-DIMM) |
| Storage | 2,048 GB | 2,048 GB |
| Storage type | PCIe Gen5 NVMe M.2 SSD | PCIe 5.0 NVMe SSD |
Benchmarks
| Spec | HP ZBook Fury G1i 18 | MSI Raider A18 HX A9W |
|---|---|---|
| Geekbench 6 (single) | 3,028Top 20% | 3,146+4%Top 11% |
| Geekbench 6 (multi) | 18,285Top 17% | 19,922+9%Top 10% |
| 3DMark Time Spy Graphics (GPU) | 21,744Top 19% | 22,099+2%Top 9% |
Battery
| Spec | HP ZBook Fury G1i 18 | MSI Raider A18 HX A9W |
|---|---|---|
| Capacity | 99 Wh | 99.9 Wh+1% |
| Web browsing endurance | 8 h+286% | 2.1 h |
| Charging | 330 W | 400 W+21% |
Design
| Spec | HP ZBook Fury G1i 18 | MSI Raider A18 HX A9W |
|---|---|---|
| Weight | 3.52 kg+2% | 3.6 kg |
| Thickness | 27 mm+16% | 32.1 mm |
| Material | Aluminum alloy chassis | — |
Connectivity
| Spec | HP ZBook Fury G1i 18 | MSI Raider A18 HX A9W |
|---|---|---|
| Ports | 2x Thunderbolt 5 (USB-C, 80Gbps, USB Power Delivery, DisplayPort 2.1), 1x Thunderbolt 4 (USB-C, 40Gbps, USB Power Delivery, DisplayPort 2.1), 1x USB-A 10Gbps, HDMI 2.1, RJ-45 2.5GbE, SD card reader, smart card reader, 3.5mm combo jack, nano security lock slot | 2x USB4 Type-C (DisplayPort, PD 3.1, Thunderbolt 4 compatible), 1x USB-A 3.2 Gen 2, 2x USB-A 3.2 Gen 1, HDMI 2.1, 2.5GbE RJ45, SD Express card reader, 3.5mm combo jack, Kensington lock |
| Wi-Fi | Wi-Fi 7 (Intel BE200, 2x2) | Wi-Fi 7 |
| Bluetooth | 5.4 | 5.4 |
| Webcam | 5MP camera with privacy shutter (IR camera optional) | 1080p IR with privacy shutter |
| Biometrics | Optional fingerprint reader (power button) and optional IR face recognition (Windows Hello) | Fingerprint reader, IR facial recognition |
Software
| Spec | HP ZBook Fury G1i 18 | MSI Raider A18 HX A9W |
|---|---|---|
| Operating system | Windows 11 Pro | Windows 11 Home or Pro |
Quick answers
Which is better: HP ZBook Fury G1i 18 or MSI Raider A18 HX A9W?
This one is close to a dead heat: HP ZBook Fury G1i 18 scores 57 against 56.7 for MSI Raider A18 HX A9W. Pick by the categories that matter to you, or by price.
How do the scores compare?
HP ZBook Fury G1i 18 scores 57/100 overall; MSI Raider A18 HX A9W scores 56.7/100. HP ZBook Fury G1i 18 wins 4 individual spec rows, MSI Raider A18 HX A9W wins 6.
What are the main differences between the HP ZBook Fury G1i 18 and the MSI Raider A18 HX A9W?
HP ZBook Fury G1i 18 advantages: 286% higher web browsing endurance: 8 h vs 2.1 h; 38% higher refresh rate: 165 Hz vs 120 Hz; 16% lower thickness: 27 mm vs 32.1 mm. MSI Raider A18 HX A9W advantages: 9% higher Geekbench 6 (multi): 19,922 vs 18,285; 78% higher peak brightness: 889 nits vs 500 nits; 21% higher charging: 400 W vs 330 W.
Use this on your site or forum
Copy a ready-made link. Scores on this page update as new results are published, so the link always leads to the current figures.