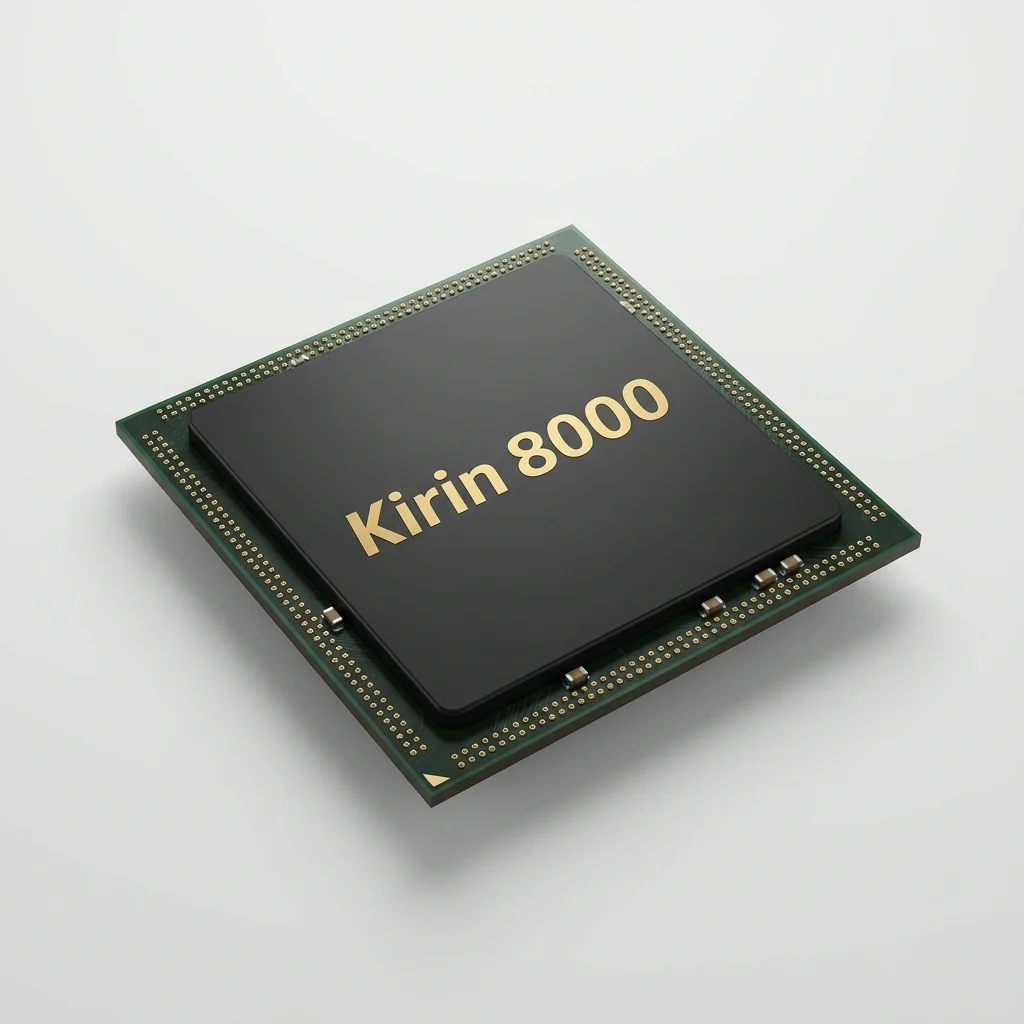
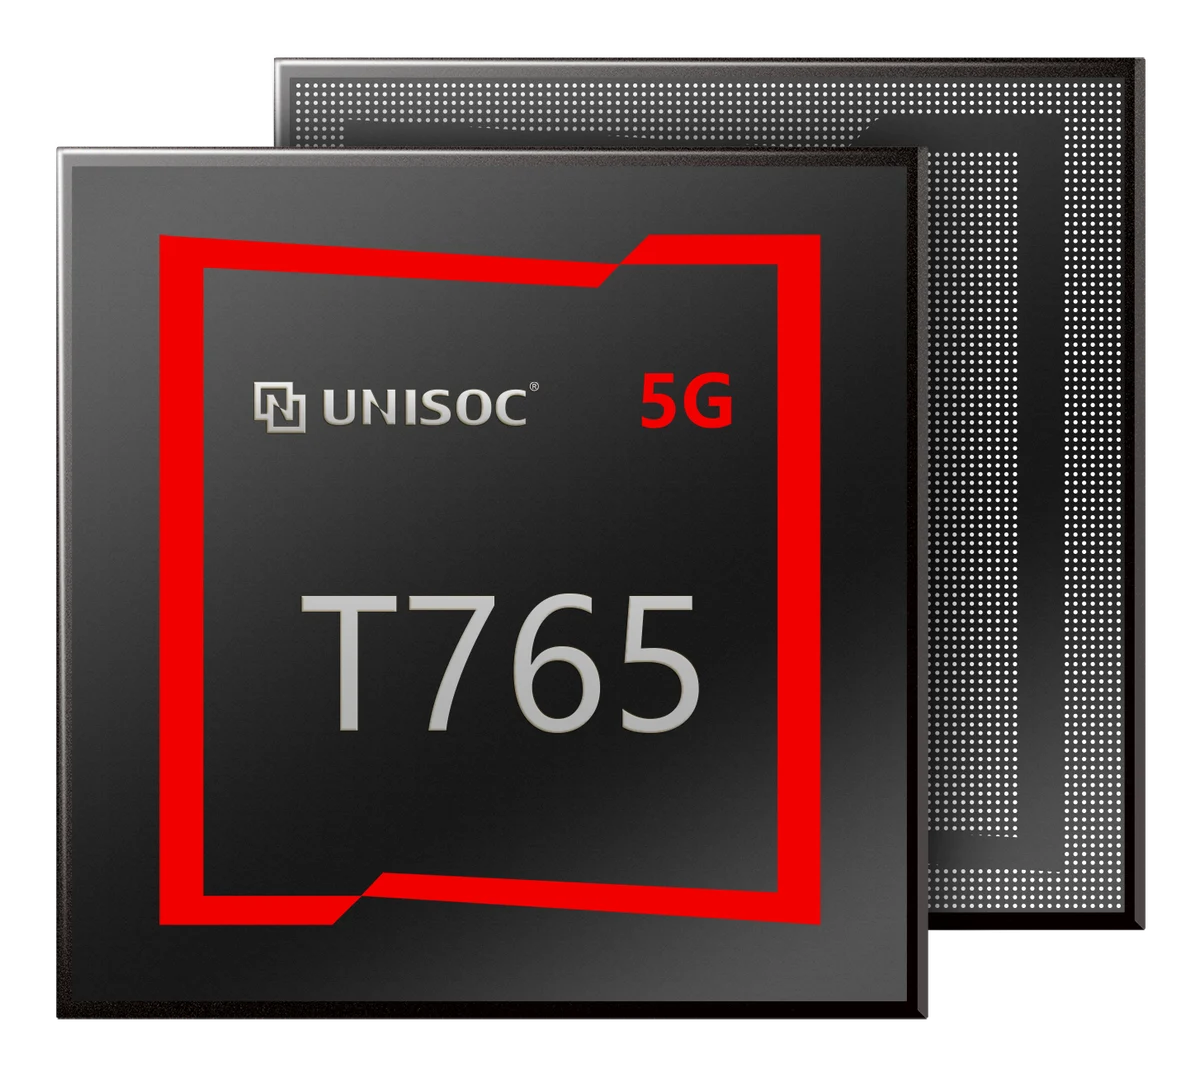
Huawei Kirin 8000 vs Unisoc T765
28.9CPU24.5
26.2GPU25.7
46.6Benchmarks—
20Efficiencyspec-based36
4 spec wins — Huawei Kirin 80001 spec wins — Unisoc T765
InnoReviews verdict
This one is close to a dead heat: Huawei Kirin 8000 scores 30.6 against 30.9 for Unisoc T765. Pick by the categories that matter to you, or by price.
Which would you pick?
Key differences
Reasons to pick the Huawei Kirin 8000
- Stronger CPU score: 29 vs 25
- 212% higher 3DMark Wild Life Extreme: 955 vs 306
- 39% higher Geekbench 6 (multi): 2,678 vs 1,925
- 35% higher Geekbench 6 (single): 993 vs 736
Reasons to pick the Unisoc T765
- 14% lower process: 6 nm vs 7 nm
General
| Spec | Huawei Kirin 8000 | Unisoc T765 |
|---|---|---|
| Announced | 2023 | 2023 |
| Process | 7 nm | 6 nm+14% |
| Architecture | — | Armv8.2 |
CPU
| Spec | Huawei Kirin 8000 | Unisoc T765 |
|---|---|---|
| Cores | 8 | 8 |
| Core configuration | 1x2.4 GHz + 3x2.19 GHz + 4x1.84 GHz | 2x2.3 GHz Cortex-A76 + 6x2.1 GHz Cortex-A55 |
| Max clock | 2.4 GHz+4% | 2.3 GHz |
GPU
| Spec | Huawei Kirin 8000 | Unisoc T765 |
|---|---|---|
| GPU | — | Arm Mali-G57 MC2 |
| GPU clock | — | 850 MHz |
Memory
| Spec | Huawei Kirin 8000 | Unisoc T765 |
|---|---|---|
| Memory type | — | LPDDR4X-2133 |
Connectivity
| Spec | Huawei Kirin 8000 | Unisoc T765 |
|---|---|---|
| Modem | — | Integrated 5G (SA/NSA), LTE Cat-15 (DL) / Cat-18 (UL) |
| Wi-Fi | — | Wi-Fi 5 |
| Bluetooth | — | 5.0 |
Media
| Spec | Huawei Kirin 8000 | Unisoc T765 |
|---|---|---|
| Max display | — | FHD+ @ 120Hz |
| Video capture | — | 4K@30fps |
Benchmarks
| Spec | Huawei Kirin 8000 | Unisoc T765 |
|---|---|---|
| AnTuTu | 720,605Bottom 21% | — |
| AnTuTu 11 (CPU) | 275,622Bottom 24% | — |
| AnTuTu 11 (GPU) | 95,326Bottom 26% | — |
| AnTuTu 11 (Memory) | 153,530Bottom 31% | — |
| AnTuTu 11 (UX) | 196,127Bottom 20% | — |
| AnTuTu 12 | 799,448Bottom 25% | — |
| Geekbench 6 (single) | 993+35%Bottom 44% | 736Bottom 27% |
| Geekbench 6 (multi) | 2,678+39%Bottom 45% | 1,925Bottom 27% |
| 3DMark Wild Life Extreme | 955+212%Top 47% | 306Bottom 22% |
Related comparisons
Huawei Kirin 8000vs Qualcomm Snapdragon 732GVSHuawei Kirin 8000vs Unisoc T8200VSHuawei Kirin 8000vs Qualcomm Snapdragon 685VSHuawei Kirin 8000vs Qualcomm Snapdragon 695VSUnisoc T765vs Qualcomm Snapdragon 685VSUnisoc T765vs Qualcomm Snapdragon 695VSUnisoc T765vs MediaTek Dimensity 6300VSUnisoc T765vs Qualcomm Snapdragon 732GVS