Smartphone Processor Ranking 2026 — Page 2
Qualcomm Snapdragon 8 Elite Extreme Gen 6 leads 211 mobile chipsets with an Inno Score of 95.5/100. Ordered by overall Inno Score — computed from real benchmark and spec data, updated as new devices launch. Click a column to re-rank. Last updated Nov 22, 2026.
Showing 201–211 of 211 · Download all 211 as CSV
Benchmark leaderboards:AnTuTu 11AnTuTu 12Geekbench 6
| # | Device | Inno Score | CPU | GPU | Benchmarks | AI | Efficiency | AnTuTu | Geekbench 6single / multi |
|---|---|---|---|---|---|---|---|---|---|
| 201 | 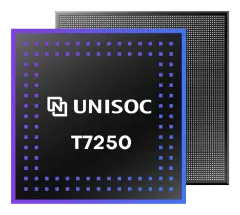 Unisoc T7250Unisoc · 2024 | 22.8 | 20 | 25 | — | — | 20 | — | 429 / 1,402 |
| 202 | 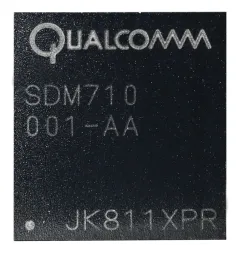 Qualcomm Snapdragon 710Qualcomm · 2018 | 22.7 | 21 | 20 | — | — | 20 | — | 393 / 1,478GB5 |
| 203 |  Unisoc T616Unisoc · 2022 | 22.3 | 20 | 24 | — | — | 20 | — | 435 / 1,553 |
| 204 |  MediaTek Helio G92 MaxMediaTek · 2024 | 21.8 | 20 | 20 | — | — | 20 | — | 445 / 1,398 |
| 205 | 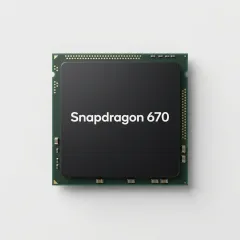 Qualcomm Snapdragon 670Qualcomm · 2018 | 21.7 | 20 | 20 | — | — | 20 | — | 349 / 1,343GB5 |
| 206 | 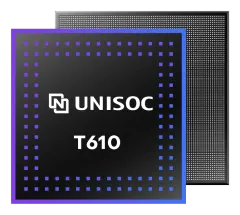 Unisoc T610Unisoc · 2021 | 21.5 | 20 | 22 | — | — | 20 | — | 417 / 1,361 |
| 207 | 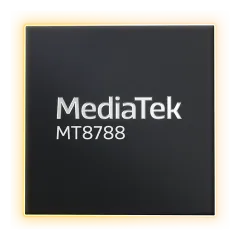 MediaTek MT8788MediaTek · 2019 | 21.2 | 20 | 20 | — | — | 20 | — | 329 / 1,284 |
| 208 | 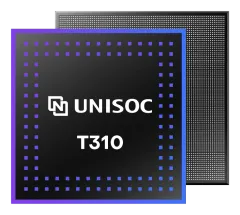 Unisoc T310Unisoc · 2019 | 21.2 | 20 | 24 | — | — | 20 | — | 376 / 756GB5 |
| 209 | 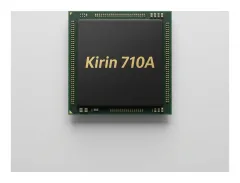 Huawei Kirin 710AHuawei · 2020 | 20.7 | 20 | 20 | — | — | 20 | — | 323 / 1,172 |
| 210 |  Qualcomm Snapdragon 6s 4G Gen 1Qualcomm · 2024 | 20.4 | 21 | 20 | — | — | 20 | — | 336 / 1,158 |
| 211 | 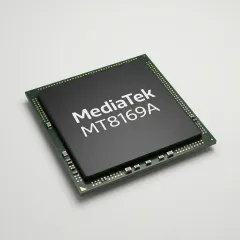 MediaTek MT8169AMediaTek · 2022 | 20.0 | 20 | 20 | — | — | 20 | — | 185 / 851GB5 |
The benchmark columns show published results from their owners (AnTuTu, Geekbench, PassMark, UL's 3DMark), not tests of our own; each chip's page names the source. Totals tagged V12 come from AnTuTu 12, which uses a different scale, so they are not comparable with the others. Results tagged GB7 are Geekbench 7 runs for a chip with no Geekbench 6 result; the scale differs, so they are not comparable with Geekbench 6 figures. Results tagged GB5 are Geekbench 5 runs for a pre-2023 chip with no Geekbench 6 or 7 result; that scale runs lower, so they are not comparable with Geekbench 6 figures.
Scores follow the public Inno Score methodology — computed from specs and benchmarks, renormalized when data is missing.